Fig. 7.
Download original image
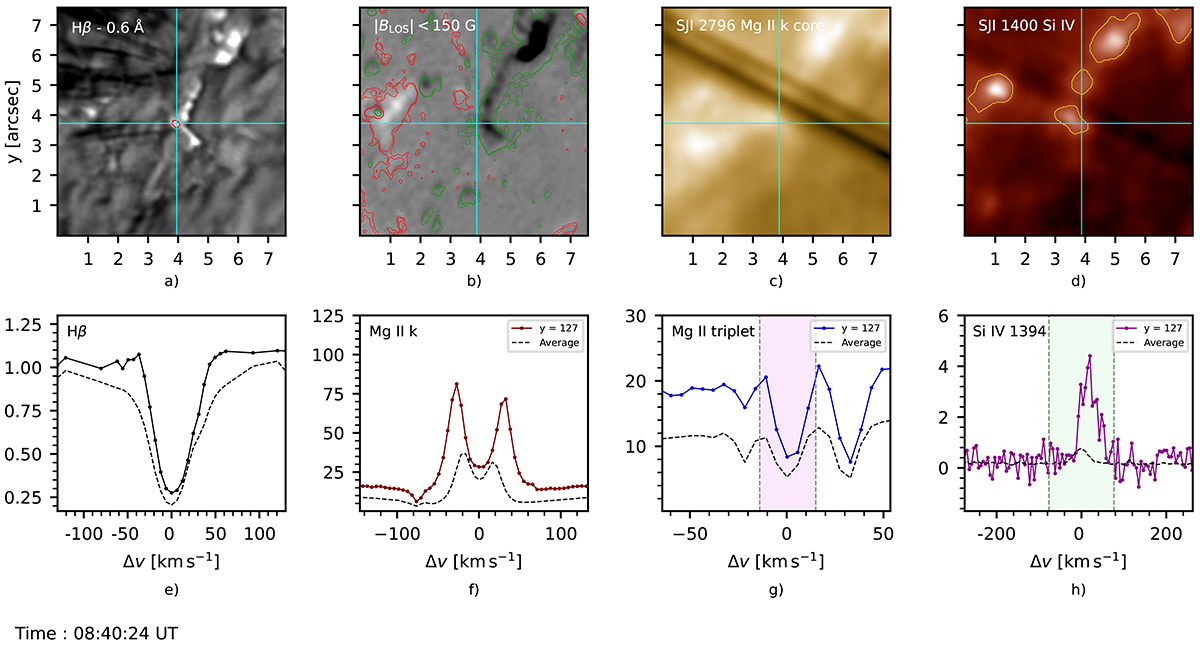
Snapshot of images and spectra of QSEB – 1 at the instance of maximum Si IV 1394 Å emission. The QSEB is located at y = 126 (in IRIS pixels) and at t = 08 : 40 : 24 UT. The top row shows the QSEB in Hβ −0.6 Å, the BLOS map with contours at 3σ above the noise level, and SJI 2796 and 1400. The 5σ contours are shown in yellow in SJI 1400. The lower row shows the normalized intensity in Hβ at the point of crossing of the cyan lines in the above Hβ −0.6 Å image. The spectral profiles of Mg II k 2796.39 Å, the Mg II triplet 2798.8 Å, and Si IV 1394 Å are shown for the region covered by the slit at y = 127, which is at a spatial offset of one pixel from the location of QSEB and are in units of DN s−1. An animation of this figure is available online.
Current usage metrics show cumulative count of Article Views (full-text article views including HTML views, PDF and ePub downloads, according to the available data) and Abstracts Views on Vision4Press platform.
Data correspond to usage on the plateform after 2015. The current usage metrics is available 48-96 hours after online publication and is updated daily on week days.
Initial download of the metrics may take a while.