Fig. 6.
Download original image
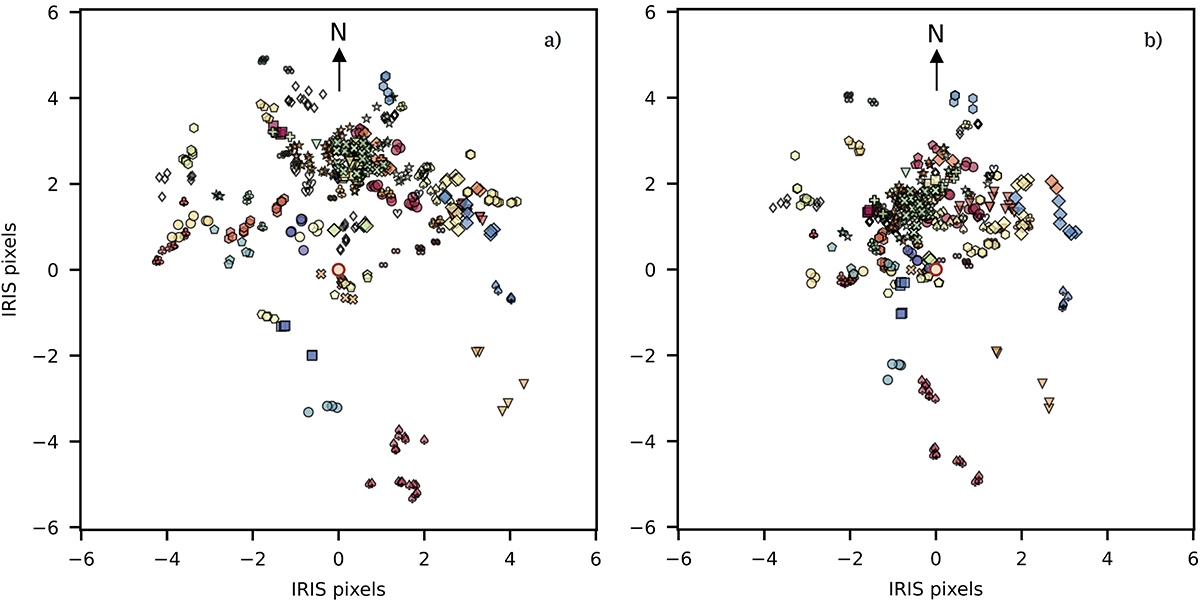
Spatial distribution of the 53 co-temporal UV brightenings around the QSEBs. Each QSEB is put at the center of the figure denoted by the shaded red circle. For each UV brightening, the colored markers are shown for all the overlapping instances of occurrence, and at distances and angles calculated with their respective QSEBs. Panel a distributes the UV brightenings based on the distance of their centroids from the QSEBs. Panel b distributes the UV brightenings based on the distance of their nearest boundaries from the QSEBs. The direction of the nearest solar limb is toward the north. Here, the x and y axis have units in IRIS pixels (1 pixel = 0![]() 33).
33).
Current usage metrics show cumulative count of Article Views (full-text article views including HTML views, PDF and ePub downloads, according to the available data) and Abstracts Views on Vision4Press platform.
Data correspond to usage on the plateform after 2015. The current usage metrics is available 48-96 hours after online publication and is updated daily on week days.
Initial download of the metrics may take a while.