Fig. 5.
Download original image
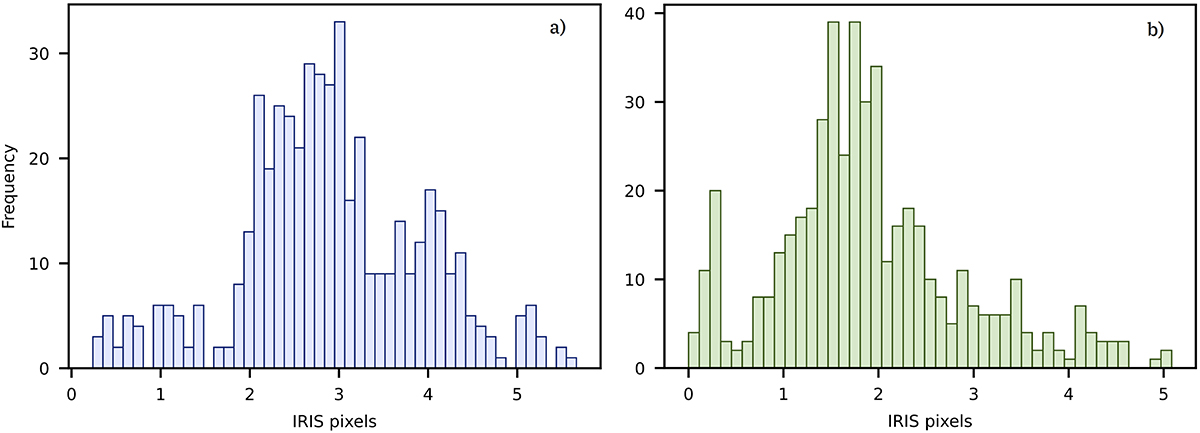
Histograms of the distance from the QSEB centroid to the UV brightenings. Panel (a) shows the distance to the centroid of the UV brightenings, while panel (b) shows the distance to the nearest boundary of the UV brightenings. The size of each bin corresponds to the angular size of 1 SST pixel (0![]() 038) and the x – axis has units in IRIS pixels (1 pixel = 0
038) and the x – axis has units in IRIS pixels (1 pixel = 0![]() 33).
33).
Current usage metrics show cumulative count of Article Views (full-text article views including HTML views, PDF and ePub downloads, according to the available data) and Abstracts Views on Vision4Press platform.
Data correspond to usage on the plateform after 2015. The current usage metrics is available 48-96 hours after online publication and is updated daily on week days.
Initial download of the metrics may take a while.