Fig. 4.
Download original image
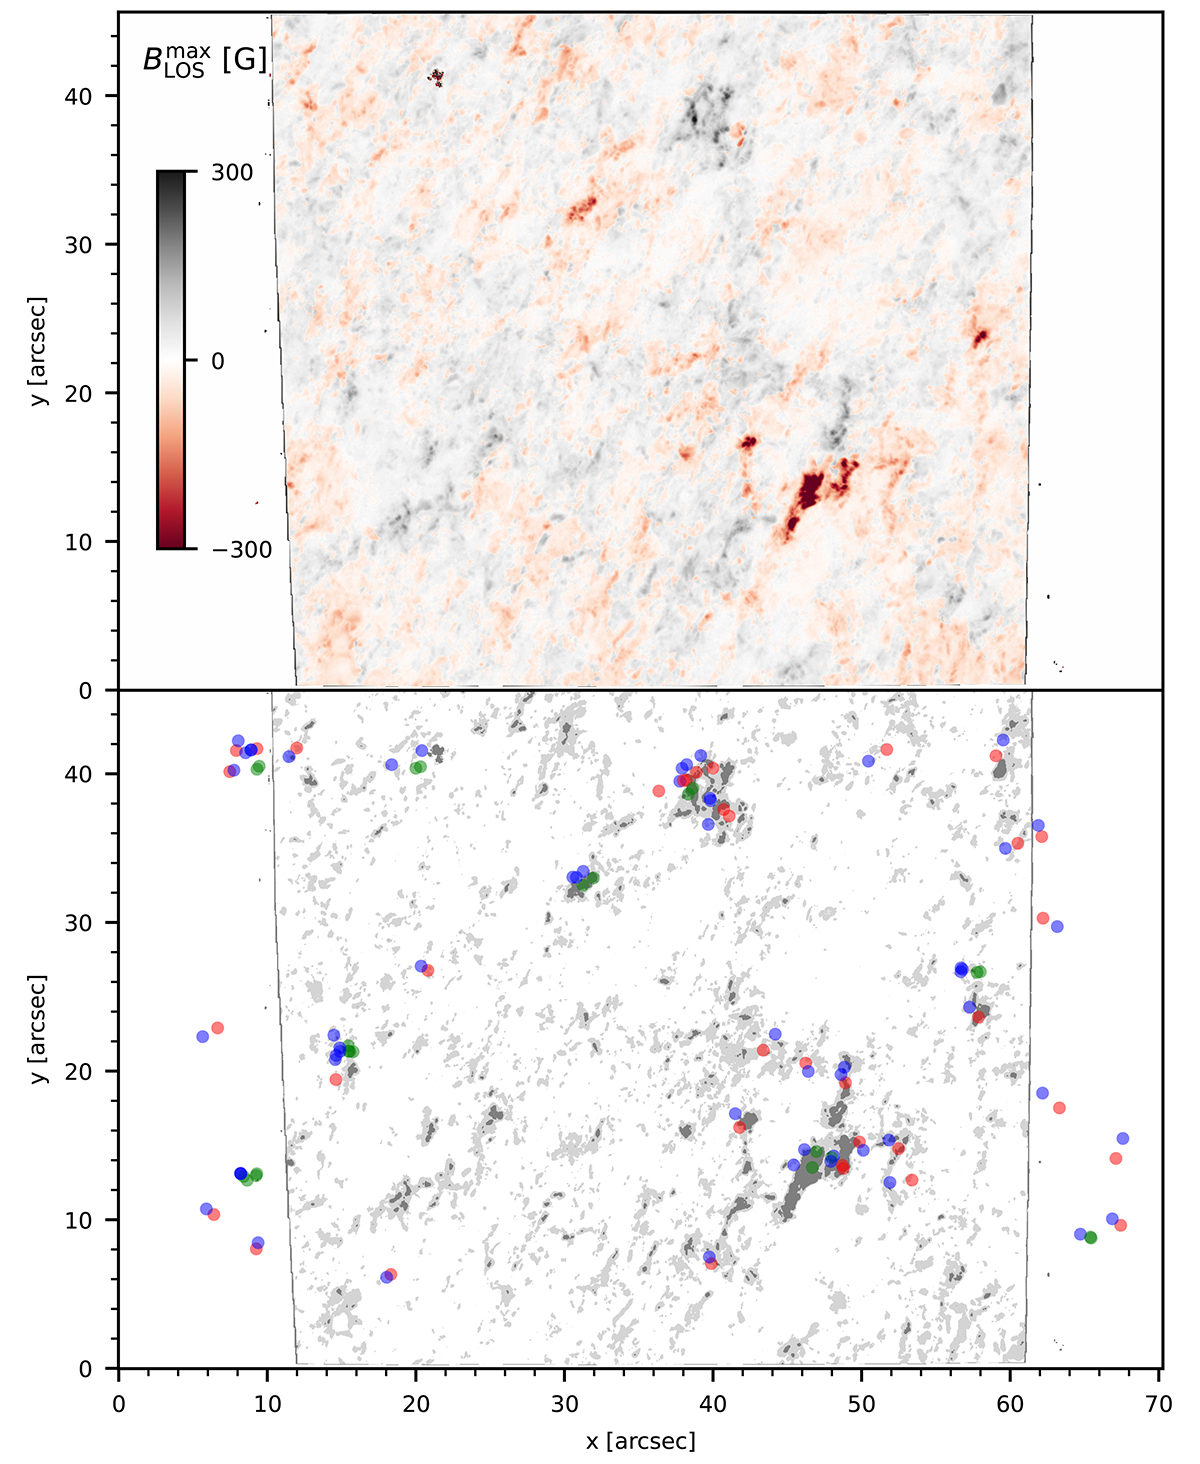
Spatial distribution of the QSEBs, UV brightenings, and their magnetic environment. The top panel shows the extremum of BLOS at each pixel for the full 51 min duration of the time series. The bottom panel shows the QSEBs (red), and the UV brightenings (blue). The green circles represent the QSEBs that have multiple occurrences during the entire duration. In the background, dark gray areas indicates regions with ![]() , while light gray areas indicate regions where
, while light gray areas indicate regions where ![]() . The CRISP FOV of the Fe I 6173 Å data that provided the BLOS data is narrower than the CHROMIS FOV.
. The CRISP FOV of the Fe I 6173 Å data that provided the BLOS data is narrower than the CHROMIS FOV.
Current usage metrics show cumulative count of Article Views (full-text article views including HTML views, PDF and ePub downloads, according to the available data) and Abstracts Views on Vision4Press platform.
Data correspond to usage on the plateform after 2015. The current usage metrics is available 48-96 hours after online publication and is updated daily on week days.
Initial download of the metrics may take a while.