Fig. 3.
Download original image
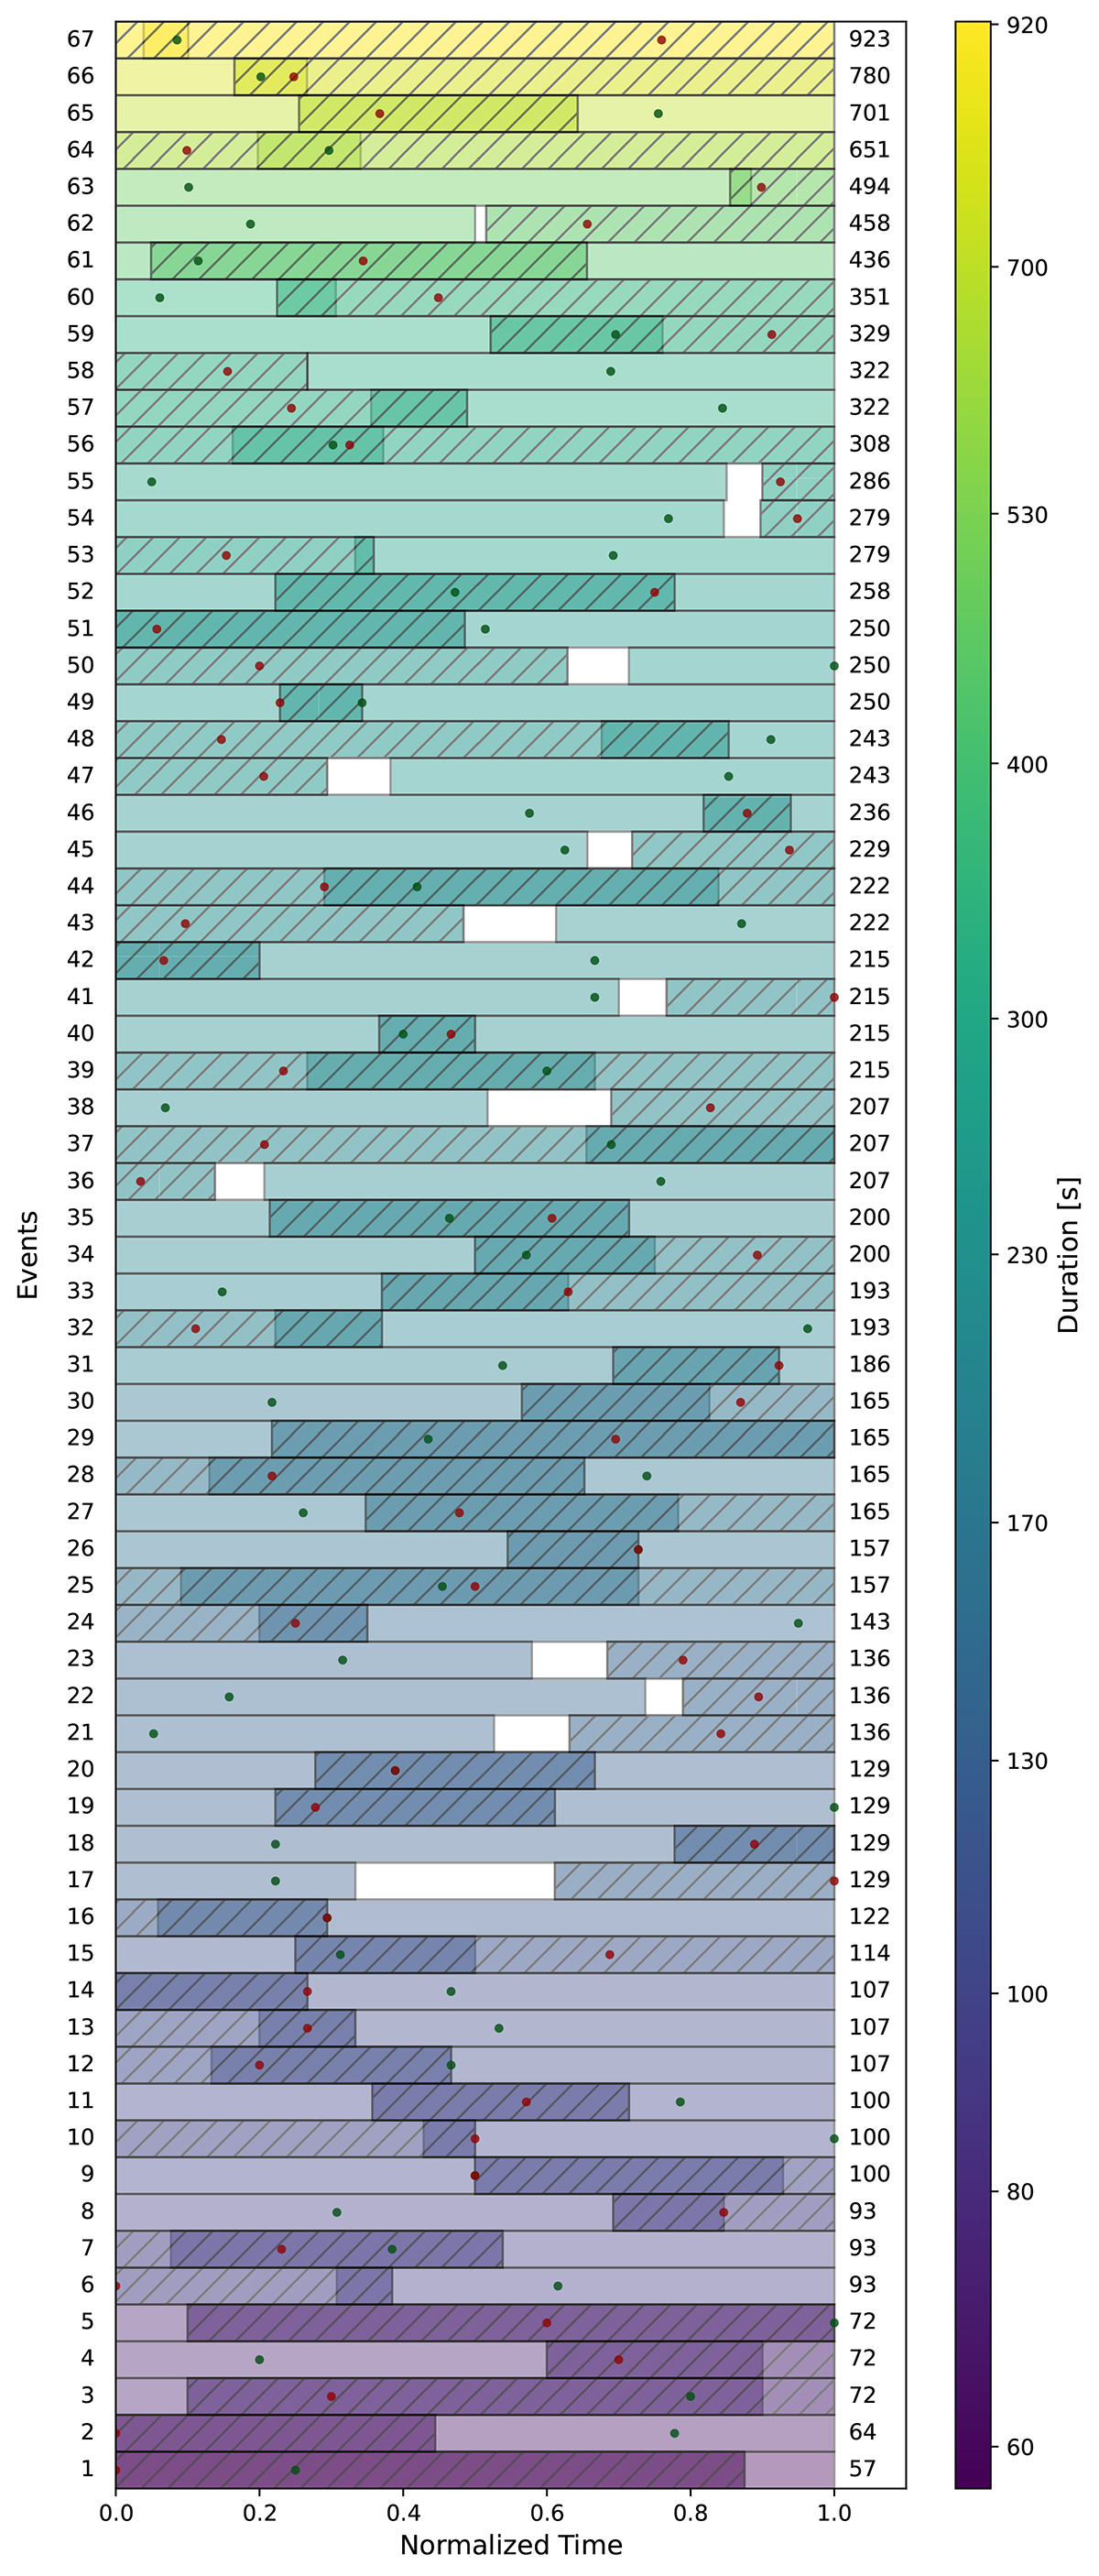
Temporal evolution of the 67 QSEBs and UV brightening pairs. The events are shown in order of increasing duration. The combined duration of each event pair is given in seconds to the right of each bar. The duration of each QSEB and UV brightening is normalized to a common bar length. For each case, the lighter region of the bar denotes the time when the QSEB occurs, and the region marked with diagonal lines denotes the time when the UV brightening occurs. The darker part of the bar is the time when the QSEB and UV brightening occur together. The time of peak intensity of the QSEB is marked with a green dot, and the time of peak intensity of the UV brightening is marked with a red dot.
Current usage metrics show cumulative count of Article Views (full-text article views including HTML views, PDF and ePub downloads, according to the available data) and Abstracts Views on Vision4Press platform.
Data correspond to usage on the plateform after 2015. The current usage metrics is available 48-96 hours after online publication and is updated daily on week days.
Initial download of the metrics may take a while.