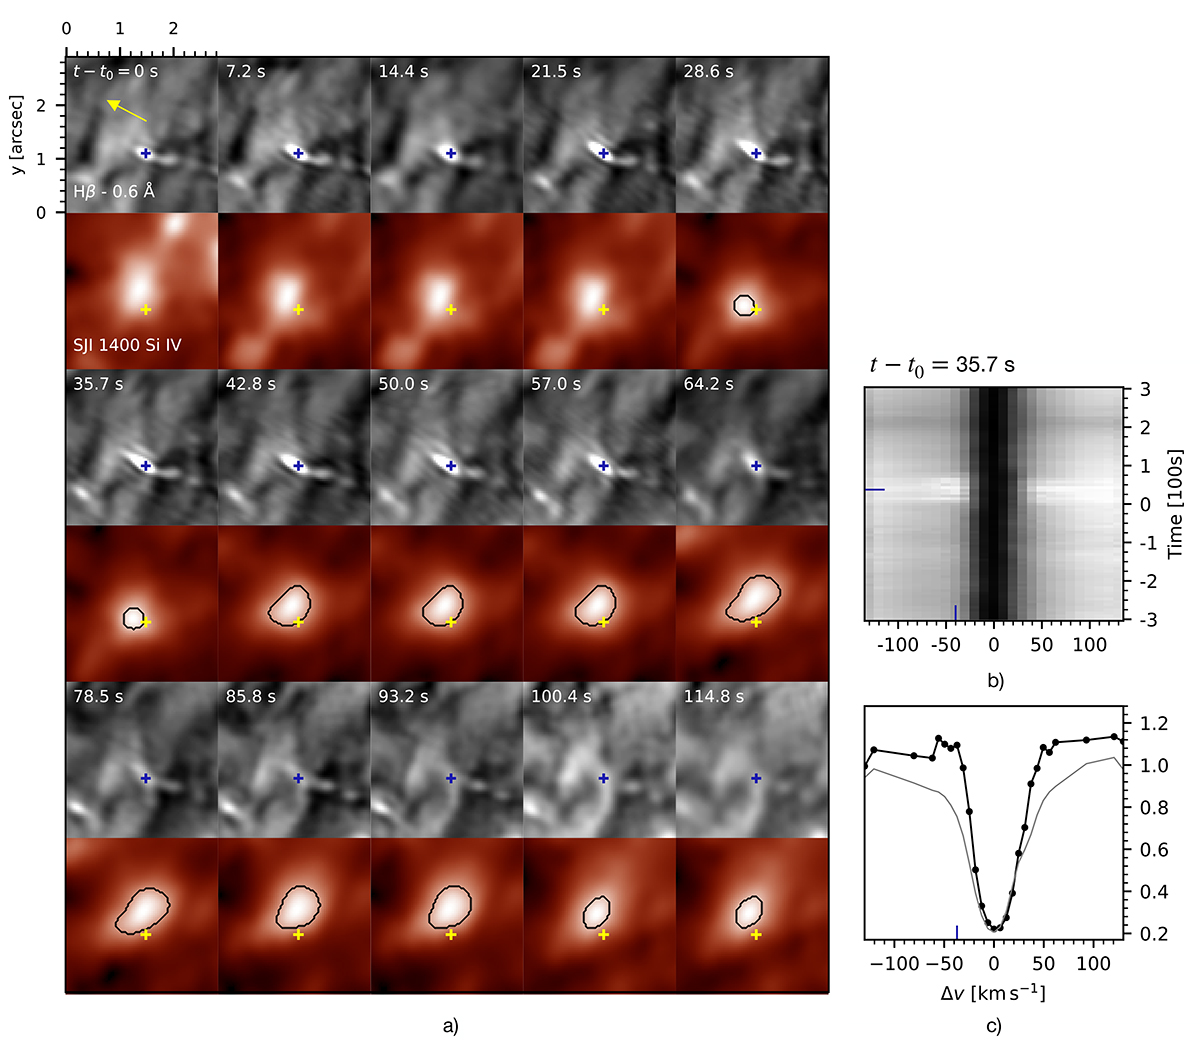
Fig. 2.
Download original image
Temporal evolution of a QSEB and associated UV brightening. The dark blue plus symbol marks the position of the QSEB in the Hβ −0.6 Å wing and a yellow plus symbol marks its position in SJI 1400. Black contours in SJI 1400 denote the UV brightening. The λt diagram to the right in panel (b) shows the spectral evolution at the pixel location marked with a plus in the Hβ wing. The light gray profile is an averaged reference profile. The vertical blue markers in panels b) and c) denote the Hβ line wing position for which the QSEB is shown in a). An animation of this figure, which shows the evolution of the QSEB with the UV brightening along with the Hβ spectral profile, is available online.
Current usage metrics show cumulative count of Article Views (full-text article views including HTML views, PDF and ePub downloads, according to the available data) and Abstracts Views on Vision4Press platform.
Data correspond to usage on the plateform after 2015. The current usage metrics is available 48-96 hours after online publication and is updated daily on week days.
Initial download of the metrics may take a while.