Fig. 16.
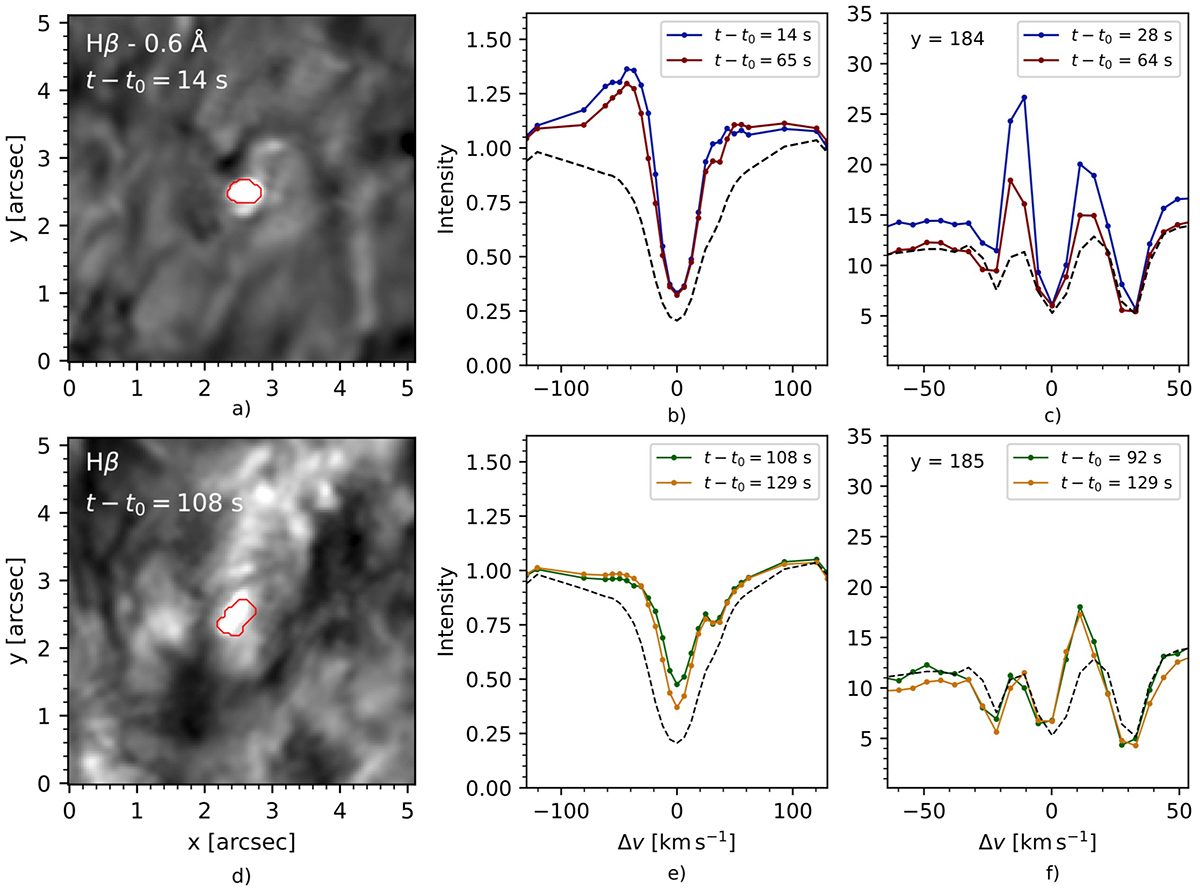
Download original image
Example of a QSEB with significant emission in the Mg II triplet lines. Panel (a) QSEB during the early phase at 14 s, which has significant wing enhancement of the Hβ spectral line. Normalized Hβ intensity is shown in panel (b) at two instances of 14 s and 65 s. Panel (c) shows the Mg II triplet profile during this early phase for two timesteps at 28 s and 64 s from y = 184 in IRIS pixels. Panel (d) shows the QSEB at 108 s during the end phase when the line core brightening of Hβ is more prominent. Spectral profiles for Hβ are shown in panel (e) for timesteps at 108 s and 129 s and for a location that is located at the top of the QSEB, which is slightly closer to the limb. Similar to panel (c), the Mg II triplet profiles are shown in panel (f) for two timesteps during the end phase of the QSEB, located at y = 185 in IRIS pixels and have units as DN s−1.
Current usage metrics show cumulative count of Article Views (full-text article views including HTML views, PDF and ePub downloads, according to the available data) and Abstracts Views on Vision4Press platform.
Data correspond to usage on the plateform after 2015. The current usage metrics is available 48-96 hours after online publication and is updated daily on week days.
Initial download of the metrics may take a while.