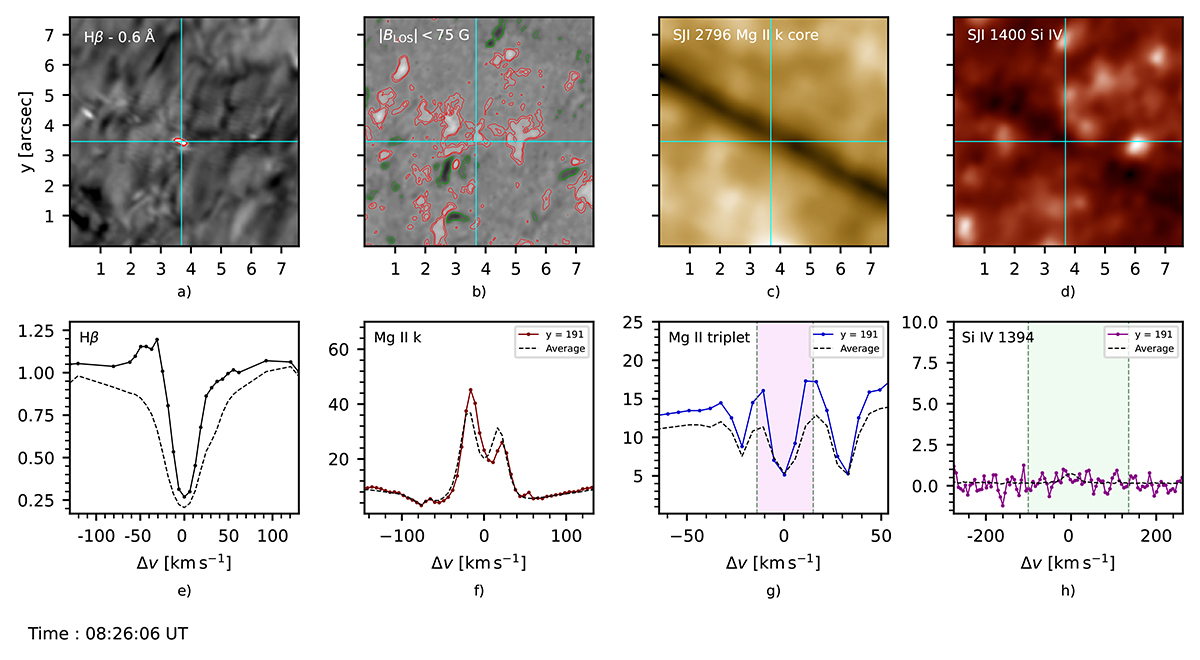
Fig. 14.
Download original image
Snapshot of images and spectra of QSEB – 3 at the instance of maximum emission in the wings of the Hβ line, with the same format as Fig. 7. The QSEB is located at y = 191 (in IRIS pixels) at t = 08 : 26 : 06 UT. Panel e) shows the normalized intensity of the Hβ line. The spectral profiles of Mg II k 2796.39 Å, Mg II triplet 2798.8 Å and Si IV 1394 Å are shown for the region covered by the slit at the site of QSEB and are in units of DN s−1.
Current usage metrics show cumulative count of Article Views (full-text article views including HTML views, PDF and ePub downloads, according to the available data) and Abstracts Views on Vision4Press platform.
Data correspond to usage on the plateform after 2015. The current usage metrics is available 48-96 hours after online publication and is updated daily on week days.
Initial download of the metrics may take a while.