Open Access
Fig. 4
Download original image
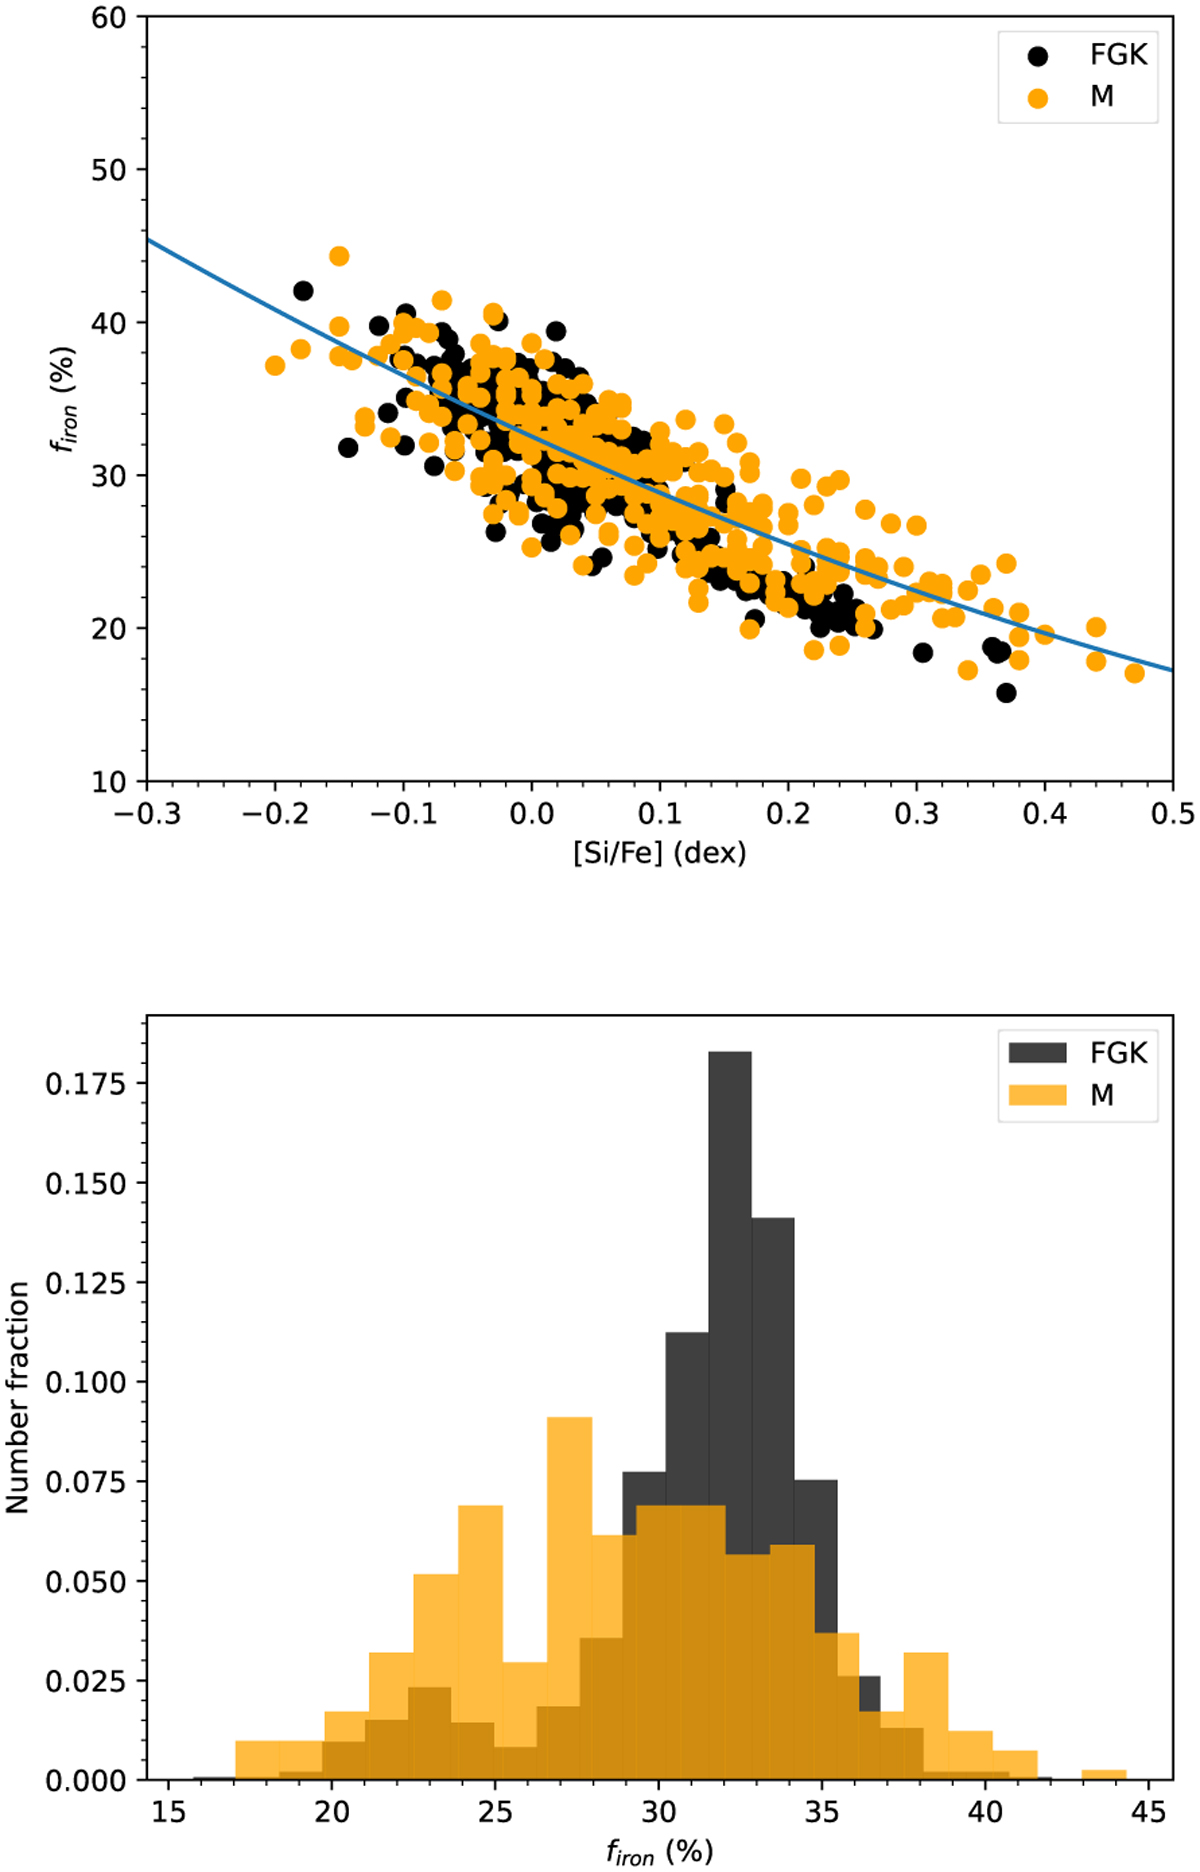
Top panel: [Si/Fe] vs. firon. The target stars are in orange while the black points correspond to the firon values computed from the Adibekyan et al. (2012) abundances. The fit through the M dwarf values is denoted with a blue line. Bottom panel: histogram for the firon values of our sample.
Current usage metrics show cumulative count of Article Views (full-text article views including HTML views, PDF and ePub downloads, according to the available data) and Abstracts Views on Vision4Press platform.
Data correspond to usage on the plateform after 2015. The current usage metrics is available 48-96 hours after online publication and is updated daily on week days.
Initial download of the metrics may take a while.