| Issue |
A&A
Volume 689, September 2024
|
|
|---|---|---|
| Article Number | A115 | |
| Number of page(s) | 8 | |
| Section | Galactic structure, stellar clusters and populations | |
| DOI | https://doi.org/10.1051/0004-6361/202450019 | |
| Published online | 06 September 2024 | |
Three new Galactic globular cluster candidates: FSR1700, Teutsch67, and CWNU4193
1
Instituto de Astrofísica, Departamento de Ciencias Físicas, Facultad de Ciencias Exactas, Universidad Andres Bello, Fernández Concha 700, Las Condes, Santiago, Chile
2
Vatican Observatory, V00120 Vatican City State, Italy
3
Observatorio Astronímico, Universidad Nacional de Córdoba, Laprida 854, X5000BGR Córdoba, Argentina
4
Instituto de Astronomía Teórica y Experimental (CONICET-UNC), Laprida 854, X5000BGR Córdoba, Argentina
5
Centro de Astronomía (CITEVA), Universidad de Antofagasta, Av. Angamos 601, Antofagasta, Chile
6
Millennium Institute of Astrophysics, Nuncio Monseñor, Sotero Sanz 100, Of. 104, Providencia, Santiago, Chile
Received:
18
March
2024
Accepted:
31
May
2024
Abstract
The VISTA Variables in the Via Láctea Extended Survey (VVVX) enables exploration of previously uncharted territories within the inner Milky Way (MW), particularly those obscured by stellar crowding and intense extinction. Our objective is to identify and investigate new star clusters to elucidate their intrinsic characteristics. Specifically, we are focused on uncovering new candidate globular clusters (GCs) situated at low Galactic latitudes, with the ultimate goal of completing the census of the MW GC system. Leveraging a combination of near-infrared (NIR) data from the VVVX survey and Two Micron All Sky Survey (2MASS), along with optical photometry and precise proper motions (PMs) from the Gaia Data Release 3 (DR3), we are conducting a systematic characterisation of new GCs. As a result, we report the discovery and characterisation of four new Galactic clusters named FSR 1700, FSR 1415, CWNU 4193, and Teutsch 67, all located within the MW disc. We estimate a wide range of reddening, with values ranging from 0.44 to 0.73 mag for E(J − Ks). The heliocentric distances span from 10.3 to 13.2 kpc. Additionally, we determine their metallicities and ages, finding a range of −0.85 to −0.75 dex for [Fe/H] and ages approximately close to 11 Gyr, respectively. FSR 1415 is an exception; it is an old open cluster with an age of 3 Gyr and [Fe/H] of −0.10. Furthermore, we fitted the radial density profiles to derive their structural parameters like the tidal radius, core radius, and concentration parameters. In conclusion, based on their positions, kinematics, metallicities, and ages, and comparing our findings with existing literature, we categorise FSR 1700, Teutsch 67, and CWNU 4193 as genuine GC candidates, while FSR 1415 is an old open cluster exhibiting characteristics of a post-core-collapse cluster.
Key words: Galaxy: disk / globular clusters: general / Galaxy: stellar content
Corresponding authors; This email address is being protected from spambots. You need JavaScript enabled to view it. .
© The Authors 2024
 Open Access article, published by EDP Sciences, under the terms of the Creative Commons Attribution License (https://creativecommons.org/licenses/by/4.0), which permits unrestricted use, distribution, and reproduction in any medium, provided the original work is properly cited.
This article is published in open access under the Subscribe to Open model. This email address is being protected from spambots. You need JavaScript enabled to view it. to support open access publication.
1. Introduction
The Milky Way (MW) environment serves as a distinctive testing ground for evaluating the predictions of cosmological models and theories of galaxy formation. Additionally, our vantage point within our own Galaxy affords us an intimate examination of old star clusters, bearing implications for extra-galactic star cluster studies. These insights become particularly significant with the advent of next-generation facilities such as NASA’s James Webb Space Telescope (JWST) and the upcoming European Extremely Large Telescope (ELT) of ESO.
Over the past decade, a plethora of new globular cluster (GC) candidates has emerged throughout the MW, particularly in the bulge regions where interstellar dust obscures baryonic matter extensively across the sky (e.g. Gonzalez et al. 2012). The challenging conditions, marked by high stellar crowding, have prompted intensified exploration. Initiatives like the VISTA Variables in the Via Lactea (VVV; Minniti et al. 2010; Saito et al. 2012) and its extension, VVVX (Minniti 2018), have significantly augmented the catalog of star cluster candidates in the MW. These investigations employ either visual inspection or photometric analysis to unveil previously unknown star clusters, showcasing remarkable success in these endeavours (e.g. Bica et al. 2019; Minniti et al. 2021a).
Minniti et al. (2017a) utilised density maps constructed solely from red giants, identifying apparent overdensities indicative of GC candidates. The authors visually inspected these overdensities, considering their size relative to known Galactic GCs (∼2′−5′), and compared the colour magnitude diagrams (CMDs) of potential candidates with those of well characterised Galactic GCs and their respective background fields. However, not all overdensities signify true clusters; some may merely constitute groups of stars or statistical fluctuations in the projected stellar density on the sky plane (Gran et al. 2019; Palma et al. 2019; Minniti et al. 2021b). Hence, one of the most dependable methods of confirming or refuting the existence of a cluster is kinematic analysis using the high precision of VVV (Smith et al. 2018) and Gaia (Gaia Collaboration 2023) proper motions (PMs; e.g. Garro et al. 2020; Obasi et al. 2021; Minniti et al. 2021a). In this work, we report the discovery and characterisation of four old star clusters: FSR 1700, FSR 1415, CWNU 4193, and Teutsch 67, which are embedded in the Galactic plane, away from the bulge.
The paper is organised as follows. In Section 2, we provide a brief overview of the datasets employed in this study. Section 3 outlines the decontamination procedure, delineating the process of extracting the cluster from the field population. The methods used to estimate the astrophysical and structural parameters are elucidated in Section 4. In Section 5, we present the results and conduct a comparative analysis with existing literature for each cluster. Finally, a summary of our findings and conclusions are presented in Section 6.
2. Datasets
We utilized the near-infrared (NIR) data acquired with the VISTA InfraRed CAMera (VIRCAM), from the VVVX survey. This survey was conducted at the 4.1 m wide-field Visible and Infrared Survey Telescope for Astronomy (VISTA; Emerson & Sutherland 2010) located at the European Southern Observatory (ESO) Paranal with a field of view of 1.5 deg2. The VVVX Survey uses the NIR passbands such as J (1.25 μm), H (1.64 μm), and Ks (2.14 μm) (see, Minniti et al. 2010; Minniti 2018; Saito et al. 2024).
Both the VVV and VVVX photometric datasets are segmented into bulge and disc tiles. Tiles d001 to d152 in the VVV survey are for the disc region and b201 to b396 are for the bulge regions. In the VVVX regions, tiles are labelled as b401 to b512 for the bulge and e601 to e988 for the disc areas. Additionally, the VVVX area includes tiles e1001 to e1180, extending from 230° to 295° in longitude and −2° to +2° in latitude. The data reduction and archival merging for the VVVX Survey is carried out by the Cambridge Astronomical Survey Unit (CASU) and by the VISTA Science Archive (VSA, Cross et al. 2012) at the Wide-Field Astronomy Unit (WFAU), using the VISTA Data Flow System (Irwin et al. 2004).
Due to the high crowding of the studied regions, point-spread-function (PSF) techniques are better designed to extract the photometry of the sources there (Alonso-García et al. 2018). A new catalogue of sources for the VVVX area in the three NIR JHKS filters using these techniques is being produced within our collaboration (Alonso-García et al., in prep), following similar steps as those described in Alonso-García et al. (2018) for creating the catalogue for the VVV original footprint. In this work, we use the PSF photometry from this new catalogue on the regions of the four sampled stellar clusters.
The 2MASS survey (Skrutskie et al. 2006) is an all-sky survey in the NIR bands J(1.25 μm), H(1.65 μm), and Ks(2.16 μm). Executed with two dedicated telescopes positioned in both hemispheres working simultaneously, achieving magnitude limits of 15.8, 15.1, and 14.3 in the J, H, and Ks bands, respectively. To enhance our dataset, we incorporated information from the 2MASS catalogue, specifically targeting brighter stars with Ks < 11 mag. This is crucial as such stars are saturated in the VVVX images. Furthermore, to ensure consistency, we converted the 2MASS photometry to the VISTA magnitude scale, as is outlined by González-Fernández et al. (2018), accounting for the different magnitude scales between the two photometric systems.
Gaia Data Release 3 (GDR3) includes the apparent brightness in G magnitude for more than 1.8 billion sources brighter than 21 mag, and full astrometric solutions for about 1.5 billion sources. Precise PMs are provided with an accuracy of 0.02 mas/yr for sources brighter than G = 15 mag, 0.07 mas/yr for sources brighter than G = 17 mag, and 0.5 mas/yr for sources brighter than G = 20 mag (Gaia Collaboration 2020). The Gaia catalogues were subjected to quality cuts. We selected sources with an astrometric excess noise < = 1.3 mas and re-normalised unit weight error (RUWE) value of < 1.2. In addition, we chose sources with a parallax < 0.5 mas to avoid severe contamination from the foreground stars. The combination of the VVVX and 2MASS NIR data, along with the precise Gaia DR3 astrometry and PMs, enables new avenues of exploration for studying challenging environments, such as the highly reddened MW bulge and disc.
The spatial density maps were constructed from the VVVX data in the Galactic coordinates, as is shown in Fig. 1. We identified the apparent overdensities from the spatial density maps in these VVVX tiles, e0748, e0618, e0634, and e1024. The overdensities correspond to the star clusters FSR 1700 (Froebrich et al. 2007), FSR 1415 (Froebrich et al. 2007), Teutsch 67 (T67, Kronberger et al. 2006), and CWNU 4193 (C4193, He et al. 2023). The spatial density plots for these clusters are depicted in Fig. 1a, 1b, 1c, and 1d, respectively. Their central coordinates and derived PMs using the VVVX data are listed in Table 1. The first three clusters were poorly classified and were analysed for the first time. FSR 1415 was classified as an old open cluster by Momany et al. 2008. Studying these clusters in the NIR with the VVVX survey offers a clearer view through interstellar dust and enables precise determination of their astrophysical parameters.
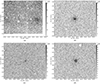 |
Fig. 1. Density map of the observed clusters using the VVVX data. The bar shows the grey scale corresponding to the number density of stars in a linear scale. (a) FSR1700, (b) FSR1415, (c) Teutsch67, (d) CWNU4193. |
Derived mean positions and PMs of the clusters
3. Decontamination procedure
Exploring the inner regions of the MW comes with its share of challenges. One significant factor is the differential reddening and extinction, impacting not only the accuracy of photometric distance estimates but also influencing the derived cluster age and metallicity, particularly in isochrone fittings. Additionally, the presence of foreground and background field contamination significantly impacts the accuracy of our results.
To refine our analysis of the clusters, we employed a decontamination procedure that relies on PM selection, to remove the field star contamination. The PMs and parallaxes for the clusters were obtained from Gaia DR3 after applying the quality cuts mentioned in the previous section. We initially merged the GDR3 and VVVX datasets with a matching radius of 0.5″ to proceed with the decontamination procedures. We chose stars with parallaxes < 0.5 mas in order to remove the foreground population.
After the initial selection of the cluster based on the overdensities in the spatial distribution, we analysed the vector point diagram (VPD) to obtain clean samples of the clusters. The VPDs were constructed as 2D histograms and are shown in Fig. 2. The cluster stars are expected to show similar motions, and they are different from those of the field stars. This method substantially reduces the field star contamination (e.g. Garro et al. 2020, 2022). By visually identifying the cluster peak in the VPDs using histograms, as is shown in Fig. 2, and its spatial distribution, we selected the cluster members that exhibit a spatial overdensity along with a peak in PMs different from that of the field. All the studied clusters show one clear overdensity in their VPDs. FSR 1415 shows a spread in overdensity in the PM space (see top right plot in Fig. 2) consisting of fluctuations in the field, which are not clustered spatially, as we can see in the spatial density map of the cluster (top right plot in Fig. 2). We estimated the mean cluster PMs using the histograms of PMs in right ascension (RA) and in declination (Dec) (μδ, red histograms). The bin size of the histograms are the same as in the VPDs. The peak values and standard deviations (σ) of PMs for each cluster were derived by a Gaussian fitting procedure using a Gaussian form in TOPCAT (Taylor 2005). The dotted white circles in Fig. 2 represent the 3σ regions from the cluster mean PM. The final visual selection of the most likely cluster members was taken within the 3σ region around the peak and is indicated in the figure as the orange circle. The selected peak and 3σ region are marked in the histograms of μα and μδ as solid orange lines and dotted white lines, respectively. The derived PMs and standard deviations in PMs are summarised in Table 1 for each candidate.
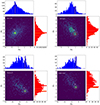 |
Fig. 2. VPDs of all the stars in the respective cluster sample. VPD is the 2D histogram, along with the separate histograms for PMRA (in blue) and PMDEC (in red). The 3σ boundary centred on the mean cluster PMs is indicated by the dotted white circles. The final selection of the most likely cluster members is made within the 3σ region, depicted by the red circle. |
4. Photometric characterisation of clusters
4.1. Astrophysical parameters
The final catalogue obtained after decontamination was used to build the CMDs of the clusters. The astrophysical parameters such as the age, metallicity ([Fe/H]), distance (D), reddening, and extinctions were derived from these clusters’ CMDs, as is detailed in Sect. 4.1.1 and 4.1.2. The use of multi-band photometry from 2MASS and Gaia along with VVVX helped us to reach more robust results. The final CMD was made by combining all three catalogues accounting for all the quality cuts mentioned in section 2. The 2MASS stars in the CMD (open circles in Fig. 3) are those bright stars (Ks > 11 mag) that are within the tidal radius and not detected with VVVX. The challenge was to find all the parameters simultaneously fitting both optical and NIR CMDs. The structural parameters of the clusters such as core radii (rc), tidal radii (rt), and the concentration parameter (C = log(rt/rc) were also derived, as is detailed in Sect. 4.2, and are provided in Table 2.
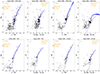 |
Fig. 3. CMDs of the clusters. For each cluster CMD on the left we have the combination of VISTA and 2MASS, whereas on the right is the Gaia CMD. The filled circles are the decontaminated cluster members from the VVVX data. The open circles in the VISTA and Gaia CMDs are the cluster members identified in the 2MASS data for the respective catalogues. The best isochrone match to the CMDs is represented by the solid blue line. The red arrows represent the reddening vectors in their respective CMDs. The error bars in the photometry have been omitted, but the typical photometric errors are δKs = 0.01 mag at Ks = 12 mag, δKs = 0.05 mag at Ks = 16 mag, and δKs = 0.3 mag at Ks = 17.5 mag, |
Derived physical parameters of the observed stellar clusters.
4.1.1. Reddening, extinction, and distance
In our estimation of reddening and extinction towards the clusters, we followed the approach outlined by Ruiz-Dern et al. (2018). Initially, we constructed the luminosity function in the Ks band for each cluster, as is illustrated in Fig. 4. The red clump (RC) positions were visually identified and are marked in the corresponding plots in Fig. 4. We then utilised the absolute magnitude of RC stars in the Ks band as MKs = −1.605 ± 0.009 mag, and their intrinsic colour as (J − Ks)0 = 0.66 ± 0.02 mag (Ruiz-Dern et al. 2018). The derived extinctions lie in the range of 0.2 < AKs < 0.52, and reddening in the range of 0.3 < E(J − Ks) < 0.7. With the aforementioned values, we calculated the heliocentric distances of the clusters by adopting the distance modulus formula. The distances vary from 9.4 kpc to 14 kpc in range.
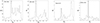 |
Fig. 4. Luminosity function in the Ks-band for each cluster, showing the peaked concentrations due to the RC stars that allowed us to determine accurate distances. The name of the corresponding cluster is also labelled. |
Additionally, we derived the extinctions and reddening in optical bands using the reddening map by Schlafly & Finkbeiner (2011), for the mean coordinates of the RC stars. We then adopted the following relations for extinctions and reddening in NIR AKs = (0.078 ± 0.004)×AV (Wang & Chen 2019). Furthermore, the extinctions and reddening in the Gaia band were derived using the relations AG = (10.116 ± 0.006)×Aks and AG = (1.89 ± 0.015)×E(BP − RP) (Wang & Chen 2019). We used reddening laws in the optical and NIR from Wang & Chen (2019) to maintain the homogeneity of the analysis.
4.1.2. Ages and metallicities
Considering the derived reddening, extinction, and distance values, PARSEC isochrones (Bressan et al. 2012) were visually fitted to determine the ages and metallicities of the clusters. We fitted the isochrones simultaneously in the NIR and optical CMDs to find the best-fitting values of all astrophysical parameters simultaneously. Initially, we fixed the reddening and distance values to those estimated from the RC stars, and fitted isochrones for different ages and metallicities. Finally, to obtain the best-fitting isochrone we simultaneously varied all the four parameters such as age, metallicity, distance, and reddening following the procedure described in Saroon et al. 2023). Concurrently fitting the isochrone in the Gaia and VISTA CMD helped us to better constrain the slope of the RGB. Knowing the positions of the RC stars from the previous section helped to add more constraints to the visual fitting procedure. The best-fitting isochrones in the VISTA and Gaia CMD are illustrated in Fig. 3. The filled circles correspond to the decontaminated cluster members from the VVVX data and the open circles represent the brighter stars obtained from 2MASS catalogue that are above the VVVX saturation limit. The red arrow represents the derived reddening vector from the isochrone fit with an angle of tan−1(AKs/E(J − Ks) in the NIR CMD and tan−1(AG/E(BP − RP) in the Gaia CMD. The best-fitting parameters obtained from the isochrones are listed in Table 2. The uncertainties in metallicities and distances in our study are estimated to be approximately 0.5 in ages and 0.2 dex in metallicities, which is consistent with findings from similar studies on GCs (e.g. Garro et al. 2022).
4.2. Structural parameters
To determine the physical size of the clusters, we computed the radial density profile (RDP). The center of the cluster was computed through a systematic procedure, beginning with initial center coordinates obtained from the literature. Subsequently, we determined the new center by calculating the median values of RA and Dec within a radius of 0.1′ from the initial center coordinates. To ensure accuracy, we assessed variations in the center coordinates by exploring different radial bins from the center. Finally, we used the center derived from the aforementioned method to construct the RDPs. The first step was dividing the sample clusters into circular different annuli with increasing radii. The number density per bin was calculated as the number of stars (N) in the bin divided by the respective area (A). The RDPs of the clusters are plotted as a function of the mean distance of the circular annulus to the cluster centre to the number density in the corresponding annuli. In our study, we employed the widely used King (1962) model to fit the cluster density profile. We used a chi-square method to derive the best-fitting model and the standard errors. The best-fit King model gives the rc, rt, and C of the clusters (see, Fig. 5). Core collapse clusters typically exhibit higher concentration parameters compared to non-core collapse clusters (Lugger et al. 1988). This implies that the central regions of core collapse clusters are denser and more tightly packed with stars compared to non-core collapse clusters. By analysing the concentration parameters of these clusters and comparing them with known GCs in the 2010 version of the Harris (1996) catalogue, it appears unlikely that FSR1700, Teutsch67, and CWNU4193 are core collapse clusters. However, the cluster FSR1415 (C ∼ 3) could belong to the category of core collapse clusters.
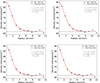 |
Fig. 5. Radial density profile of the clusters. The black points correspond to the cluster density profile, which corresponds to the number of stars per unit area within an annular region. The red line shows the best-fit King model profile (King 1962). The constant background density is marked with the dashed line. |
5. Results
Below, we discuss the estimated parameters from the isochrone fitting for each cluster accompanied by a comparison with existing literature findings, if available.
5.1. FSR 1415
The star cluster FSR 1415 was discovered by Froebrich et al. (2007), located at the J2000 equatorial coordinates α = 08 : 40 : 24, δ = −44° :43 : 05 and galactic coordinates l = 263.74°, b = −1.81°. This cluster was identified as a genuine old open cluster by Momany et al. (2008), using deep high-resolution photometry from the NIR Multi-Conjugate Adaptive Optics demonstrator at the Very Large Telescope (VLT/MAD). Momany et al. (2008) derived the age, metallicity and distances using isochrones from the Padova library (Girardi et al. 2002). Fixing a solar metallicity ([Fe/H] = 0.0 dex), they derived an age of 2.5 ± 0.7 Gyr, a heliocentric distance of d⊙ = 8.59 kpc, and AV = 4.57. The structural parameters of the cluster were derived using a three-parameter King-like function, obtaining a core radius of rc = 0.9′±0.2′ and rt = 12.2′±2.9′ (Fig. 5). The aforementioned values derived by Momany et al. (2008) are in good agreement with our estimates of age, metallicity, and distance, and the structural parameters as well. Our best-fitting PARSEC isochrone yields an age of 3 Gyr, [Fe/H] = 0.10 ± 0.2 dex, d = 10.7 ± 0.5 Kpc, and AKs = 0.31(AV = 4.03) (Fig. 3). The concentration parameter of the cluster ( C ∼ 3) is similar to what we find in post-core-collapse GCs (Trager et al. 1995). Moreover, the presence of post-core-collapse features in RDPs of open clusters has previously been detected; for instance, in the ∼1 Gyr old cluster NGC 3960 (Bica et al. 2006).
5.2. FSR 1700
The star cluster FSR1700 was discovered by Froebrich et al. (2007) and classified as a distant reddened cluster by Buckner & Froebrich (2013). This object was also recently identified as a candidate GC (He et al. 2023), and is positioned at the J2000 equatorial coordinates α = 15 : 38 : 52.5, δ = −59° :16 : 03, and galactic coordinates l = 322.9°, b = −3.05°. We utilised the Gaia PMs to derive the mean PMs of the cluster, as is detailed in Section 3. The resulting values are μα = −4.85 ± 0.25 mas yr−1 and μδ = −4.03 ± 0.23 mas yr−1, which align well with previous findings by He et al. (2023). The isochrone that best fits the CMD suggests an age of 11 Gyr, a metallicity of [Fe/H] = −0.80 ± 0.2 dex, a distance of d = 10.3 ± 0.5 kpc, and an extinction of AKs = 0.24 (3). The RDP was constructed using circular bins of 1 arcmin up to a radius of 12 arcmins. The fitted King profile yielded a core radius of rc = 2.37′±0.14′ and a tidal radius of rt = 8.96′±0.35′ (Fig. 5). The concentration parameter, C = 1.33, suggests that FSR 1700 is unlikely to be a core collapse cluster (Harris 1996).
5.3. Teutsch 67
The star cluster Teutsch67 was discovered by Kronberger et al. (2006), located at the J2000 equatorial coordinates α = 09 : 33 : 46, δ = −57° :05 : 59, and galactic coordinates l = 278.52°, b = −3.92°. Utilising Gaia PMs, we determined the mean PMs of the cluster, yielding values of μα = −2.38 ± 0.03 mas yr−1 and μδ = 1.92 ± 0.03 mas yr−1. The isochrone fitting to the CMD yields an age of 10.5 Gyr, a metallicity of [Fe/H] = −0.75 ± 0.2 dex, a distance of d = 13.2 ± 0.5 kpc, and an extinction of AKs = 0.19 (Fig. 3). Constructing the RDP involved using circular bins of 0.5 arcmin up to a radius of 6 arcmins. The fitted King profile yielded a core radius of rc = 0.59′±0.02′ and a tidal radius of rt = 3.96′±0.13′ (Fig. 5). Moreover, with a concentration parameter of C = 1.91, T67 emerges as a candidate GC, indicating it is unlikely to be a core collapse cluster.
5.4. CWNU 4193
The star cluster CWNU 4193 was recently discovered by He et al. (2023), situated at the J2000 equatorial coordinates α = 08 : 04 : 41.7, δ = −38° :55 : 16, and galactic coordinates l = 255.17°, b = −3.95°. Utilising Gaia PMs, we determined the mean PMs of the cluster, yielding values of μα = −0.792 ± 0.22 mas yr−1 and μδ = 1.63 ± 0.21 mas yr−1. The isochrone fitting to the CMD yields an age of 11 Gyr, a metallicity of [Fe/H] = −0.85 ± 0.2 dex, a distance of d = 12.8 ± 0.5 kpc, and an extinction of AKs = 0.27 (Fig. 3). Constructing the RDP involved using circular bins of 0.25 arcmin up to a radius of 12 arcmins. The fitted King profile yielded a core radius of rc = 0.69′±0.01′ and a tidal radius of rt = 3.05′±0.10′ (Fig. 5). Moreover, with a concentration parameter of C = 1.49, CWNU 4193 emerges as a GC candidate, indicating it is unlikely to be a core collapse cluster.
6. Summary
In recent decades, numerous star clusters have been uncovered within the Galactic bulge; however, many remain poorly studied. In the Galactic disc, away from the bulge, open clusters are abundant, while GCs are rare. Despite the challenges, it is crucial to discover and characterise the GCs existing in this region. In this study, we focus on four star clusters located in the aforementioned region, endeavouring to recover their principal astrophysical and structural parameters. To this end, we calculated the reddening and extinction across each cluster field by leveraging reddening maps in the NIR spectrum and measuring the position of the RC stars. Furthermore, we determined their distances utilising photometry from the VVV survey, supplemented by data from the Gaia mission. Employing the isochrone-fitting method with PARSEC isochrone models, we deduced their metallicities and ages.
The following three clusters, FSR 1700, Teutsch 67, and CWNU 4193, emerge as GC candidates. These clusters exhibit a concentration parameter lower than that typically observed for core collapse clusters. In contrast, FSR1415 is identified as an old open cluster showcasing post-core-collapse features, which typically displays a concentration parameter around C ≈ 3. Our estimations of astrophysical and structural parameters for FSR 1415 align with the findings reported by Momany et al. (2008).
We note that aside from the bulge region, the VVVX survey has been mapping the southern Galactic plane within 230 < l < 350 deg, and −4.5 < b < 4.5 deg. In this region of the sky covering 1080 sq.deg, there were only three known GCs (out of 157 objects, Harris 1996, 2010). These previously known GCs were Lynga7 (Tavarez & Friel 1995), NGC6256, and NGC5946 (Alcaino et al. 1991). Thanks to our NIR survey, a dozen additional GCs have been identified in this region. These are FSR1716=VVV-GC05 (Minniti et al. 2017b), 2MASS-GC 03=FSR1735 (Carballo-Bello et al. 2016), Garro01 (Garro et al. 2020), Ferrero 54, Patchick 125, Patchick 126, Patchick122, FSR190, and Kronberger99 (Garro et al. 2022, 2023), and FSR 1700, CWNU 2149, and Teutsch 67 (this work). In addition, a couple more GCs were recently discovered by other surveys in this region (RLGC1 by Ryu & Lee (2018), and BH140 by Cantat-Gaudin et al. 2018). There are also a few other objects (e.g. BH176 and ESO93-8) that are still being debated as old open clusters. The progress in the past decade has therefore been enormous; we now know of five times as many GCs in the VVVX region of the southern Galactic plane. Indeed, it is very important to have as complete a sample of GCs as possible, because old GCs can be used to trace the formation history of our Galaxy, revealing past events of accretion of dwarf galaxies (e.g. Massari et al. 2019; Forbes et al. 2020; Vasiliev & Baumgardt 2021). Based on these results, we can expect that a deeper and higher-resolution NIR survey of the whole Galactic plane made with the future Roman Space Telescope (Paladini et al. 2023) would find dozens of new GCs at these low latitudes, some of which may reveal concealed accretion events.
Acknowledgments
We gratefully acknowledge data from the ESO Public Survey programs 179.B-2002 and 198.B-2004 taken with the VISTA telescope, and products from the Cambridge Astronomical Survey Unit (CASU) and the Wide Field Astronomy Unit at the Royal Observatory, Edinburgh. DM thanks the support from the ANID BASAL Center for Astrophysics and Associated Technologies (CATA) projects ACE210002 and FB210003, from Fondecyt Regular No. 1220724, and from CNPq Brasil Project 350104/2022-0. This research was partially supported by the Argentinian institution SECYT (Universidad Nacional de Córdoba) and Consejo Nacional de Investigaciones Científicas y Técnicas de la República Argentina, Agencia Nacional de Promoción Científica y Tecnológica. BD acknowledges support by ANID-FONDECYT iniciación grant No. 11221366 and from the ANID Basal project FB210003. J.A.-G. acknowledges support by Fondecyt Regular 1201490 and ANID – Millennium Science Initiative Program – ICN12_009 awarded to the Millennium Institute of Astrophysics (MAS).
References
- Alcaino, G., Liller, W., Alvarado, F., & Wenderoth, E. 1991, AJ, 102, 1371 [Google Scholar]
- Alonso-García, J., Saito, R. K., Hempel, M., et al. 2018, A&A, 619, A4 [Google Scholar]
- Bica, E., Bonatto, C., & Blumberg, R. 2006, A&A, 460, 83 [NASA ADS] [CrossRef] [EDP Sciences] [Google Scholar]
- Bica, E., Pavani, D. B., Bonatto, C. J., & Lima, E. F. 2019, AJ, 157, 12 [Google Scholar]
- Bressan, A., Marigo, P., Girardi, L., et al. 2012, MNRAS, 427, 127 [NASA ADS] [CrossRef] [Google Scholar]
- Buckner, A. S. M., & Froebrich, D. 2013, MNRAS, 436, 1465 [NASA ADS] [CrossRef] [Google Scholar]
- Cantat-Gaudin, T., Vallenari, A., Sordo, R., et al. 2018, A&A, 615, A49 [NASA ADS] [CrossRef] [EDP Sciences] [Google Scholar]
- Carballo-Bello, J. A., Ramírez Alegría, S., Borissova, J., et al. 2016, MNRAS, 462, 501 [NASA ADS] [CrossRef] [Google Scholar]
- Cross, N. J. G., Collins, R. S., Mann, R. G., et al. 2012, A&A, 548, A119 [NASA ADS] [CrossRef] [EDP Sciences] [Google Scholar]
- Emerson, J., & Sutherland, W. 2010, The Messenger, 139, 2 [NASA ADS] [Google Scholar]
- Forbes, D. A., Alabi, A., Romanowsky, A. J., Brodie, J. P., & Arimoto, N. 2020, MNRAS, 492, 4874 [Google Scholar]
- Froebrich, D., Scholz, A., & Raftery, C. L. 2007, MNRAS, 374, 399 [Google Scholar]
- Gaia Collaboration 2020, VizieR On-line Data Catalog: I/350 [Google Scholar]
- Gaia Collaboration (Vallenari, A., et al.) 2023, A&A, 674, A1 [NASA ADS] [CrossRef] [EDP Sciences] [Google Scholar]
- Garro, E. R., Minniti, D., Gómez, M., et al. 2020, A&A, 642, L19 [EDP Sciences] [Google Scholar]
- Garro, E. R., Minniti, D., Gómez, M., et al. 2022, A&A, 658, A120 [NASA ADS] [CrossRef] [EDP Sciences] [Google Scholar]
- Garro, E. R., Fernández-Trincado, J. G., Minniti, D., et al. 2023, A&A, 669, A136 [NASA ADS] [CrossRef] [EDP Sciences] [Google Scholar]
- Girardi, L., Bertelli, G., Bressan, A., et al. 2002, A&A, 391, 195 [NASA ADS] [CrossRef] [EDP Sciences] [Google Scholar]
- Gonzalez, O. A., Rejkuba, M., Zoccali, M., et al. 2012, A&A, 543, A13 [NASA ADS] [CrossRef] [EDP Sciences] [Google Scholar]
- González-Fernández, C., Hodgkin, S. T., Irwin, M. J., et al. 2018, MNRAS, 474, 5459 [Google Scholar]
- Gran, F., Zoccali, M., Contreras Ramos, R., et al. 2019, A&A, 628, A45 [NASA ADS] [CrossRef] [EDP Sciences] [Google Scholar]
- Harris, W. E. 1996, AJ, 112, 1487 [Google Scholar]
- Harris, W. E. 2010, ArXiv e-prints [arXiv:1012.3224] [Google Scholar]
- He, Z., Luo, Y., Wang, K., et al. 2023, ApJS, 267, 34 [Google Scholar]
- Irwin, M. J., Lewis, J., Hodgkin, S., et al. 2004, SPIE Conf Ser., 5493, 411 [NASA ADS] [Google Scholar]
- King, I. 1962, AJ, 67, 471 [Google Scholar]
- Kronberger, M., Teutsch, P., Alessi, B., et al. 2006, A&A, 447, 921 [NASA ADS] [CrossRef] [EDP Sciences] [Google Scholar]
- Lugger, P. M., Cohn, H., Grindlay, J. E., Bailyn, C. D., & Hertz, P. 1988, IAU Symp., 126, 657 [Google Scholar]
- Massari, D., Koppelman, H. H., & Helmi, A. 2019, A&A, 630, L4 [NASA ADS] [CrossRef] [EDP Sciences] [Google Scholar]
- Minniti, D. 2018, Astrophys. Space Sci. Proc., 51, 63 [NASA ADS] [CrossRef] [Google Scholar]
- Minniti, D., Lucas, P. W., Emerson, J. P., et al. 2010, New A, 15, 433 [Google Scholar]
- Minniti, D., Geisler, D., Alonso-García, J., et al. 2017a, ApJ, 849, L24 [CrossRef] [Google Scholar]
- Minniti, D., Palma, T., Dékány, I., et al. 2017b, ApJ, 838, L14 [Google Scholar]
- Minniti, D., Fernández-Trincado, J. G., Gómez, M., et al. 2021a, A&A, 650, L11 [NASA ADS] [CrossRef] [EDP Sciences] [Google Scholar]
- Minniti, D., Palma, T., & Clariá, J. J. 2021b, Boletin de la Asociacion Argentina de Astronomia La Plata Argentina, 62, 107 [NASA ADS] [Google Scholar]
- Momany, Y., Ortolani, S., Bonatto, C., Bica, E., & Barbuy, B. 2008, MNRAS, 391, 1650 [NASA ADS] [CrossRef] [Google Scholar]
- Obasi, C., Gómez, M., Minniti, D., & Alonso-García, J. 2021, A&A, 654, A39 [NASA ADS] [CrossRef] [EDP Sciences] [Google Scholar]
- Paladini, R., Zucker, C., Benjamin, R., et al. 2023, ArXiv e-prints [arXiv:2307.07642] [Google Scholar]
- Palma, T., Minniti, D., Alonso-García, J., et al. 2019, MNRAS, 487, 3140 [Google Scholar]
- Ruiz-Dern, L., Babusiaux, C., Arenou, F., Turon, C., & Lallement, R. 2018, A&A, 609, A116 [NASA ADS] [CrossRef] [EDP Sciences] [Google Scholar]
- Ryu, J., & Lee, M. G. 2018, ApJ, 863, L38 [NASA ADS] [CrossRef] [Google Scholar]
- Saito, R. K., Hempel, M., Minniti, D., et al. 2012, A&A, 537, A107 [NASA ADS] [CrossRef] [EDP Sciences] [Google Scholar]
- Saito, R. K., Hempel, M., Alonso-García, J., et al. 2024, A&A, in press, https://doi.org/10.1051/0004-6361/202450584 [Google Scholar]
- Saroon, S., Dias, B., Tsujimoto, T., et al. 2023, A&A, 677, A35 [NASA ADS] [CrossRef] [EDP Sciences] [Google Scholar]
- Schlafly, E. F., & Finkbeiner, D. P. 2011, ApJ, 737, 103 [Google Scholar]
- Skrutskie, M. F., Cutri, R. M., Stiening, R., et al. 2006, AJ, 131, 1163 [NASA ADS] [CrossRef] [Google Scholar]
- Smith, L., Lucas, P., Kurtev, R., et al. 2018, MNRAS, 474, 1826 [NASA ADS] [CrossRef] [Google Scholar]
- Tavarez, M., & Friel, E. D. 1995, AJ, 110, 223 [CrossRef] [Google Scholar]
- Taylor, M. B. 2005, ASP Conf. Ser., 347, 29 [Google Scholar]
- Trager, S. C., King, I. R., & Djorgovski, S. 1995, AJ, 109, 218 [NASA ADS] [CrossRef] [Google Scholar]
- Vasiliev, E., & Baumgardt, H. 2021, MNRAS, 505, 5978 [NASA ADS] [CrossRef] [Google Scholar]
- Wang, S., & Chen, X. 2019, ApJ, 877, 116 [Google Scholar]
All Tables
All Figures
|
Fig. 1. Density map of the observed clusters using the VVVX data. The bar shows the grey scale corresponding to the number density of stars in a linear scale. (a) FSR1700, (b) FSR1415, (c) Teutsch67, (d) CWNU4193. |
| In the text | |
|
Fig. 2. VPDs of all the stars in the respective cluster sample. VPD is the 2D histogram, along with the separate histograms for PMRA (in blue) and PMDEC (in red). The 3σ boundary centred on the mean cluster PMs is indicated by the dotted white circles. The final selection of the most likely cluster members is made within the 3σ region, depicted by the red circle. |
| In the text | |
|
Fig. 3. CMDs of the clusters. For each cluster CMD on the left we have the combination of VISTA and 2MASS, whereas on the right is the Gaia CMD. The filled circles are the decontaminated cluster members from the VVVX data. The open circles in the VISTA and Gaia CMDs are the cluster members identified in the 2MASS data for the respective catalogues. The best isochrone match to the CMDs is represented by the solid blue line. The red arrows represent the reddening vectors in their respective CMDs. The error bars in the photometry have been omitted, but the typical photometric errors are δKs = 0.01 mag at Ks = 12 mag, δKs = 0.05 mag at Ks = 16 mag, and δKs = 0.3 mag at Ks = 17.5 mag, |
| In the text | |
|
Fig. 4. Luminosity function in the Ks-band for each cluster, showing the peaked concentrations due to the RC stars that allowed us to determine accurate distances. The name of the corresponding cluster is also labelled. |
| In the text | |
|
Fig. 5. Radial density profile of the clusters. The black points correspond to the cluster density profile, which corresponds to the number of stars per unit area within an annular region. The red line shows the best-fit King model profile (King 1962). The constant background density is marked with the dashed line. |
| In the text | |
Current usage metrics show cumulative count of Article Views (full-text article views including HTML views, PDF and ePub downloads, according to the available data) and Abstracts Views on Vision4Press platform.
Data correspond to usage on the plateform after 2015. The current usage metrics is available 48-96 hours after online publication and is updated daily on week days.
Initial download of the metrics may take a while.