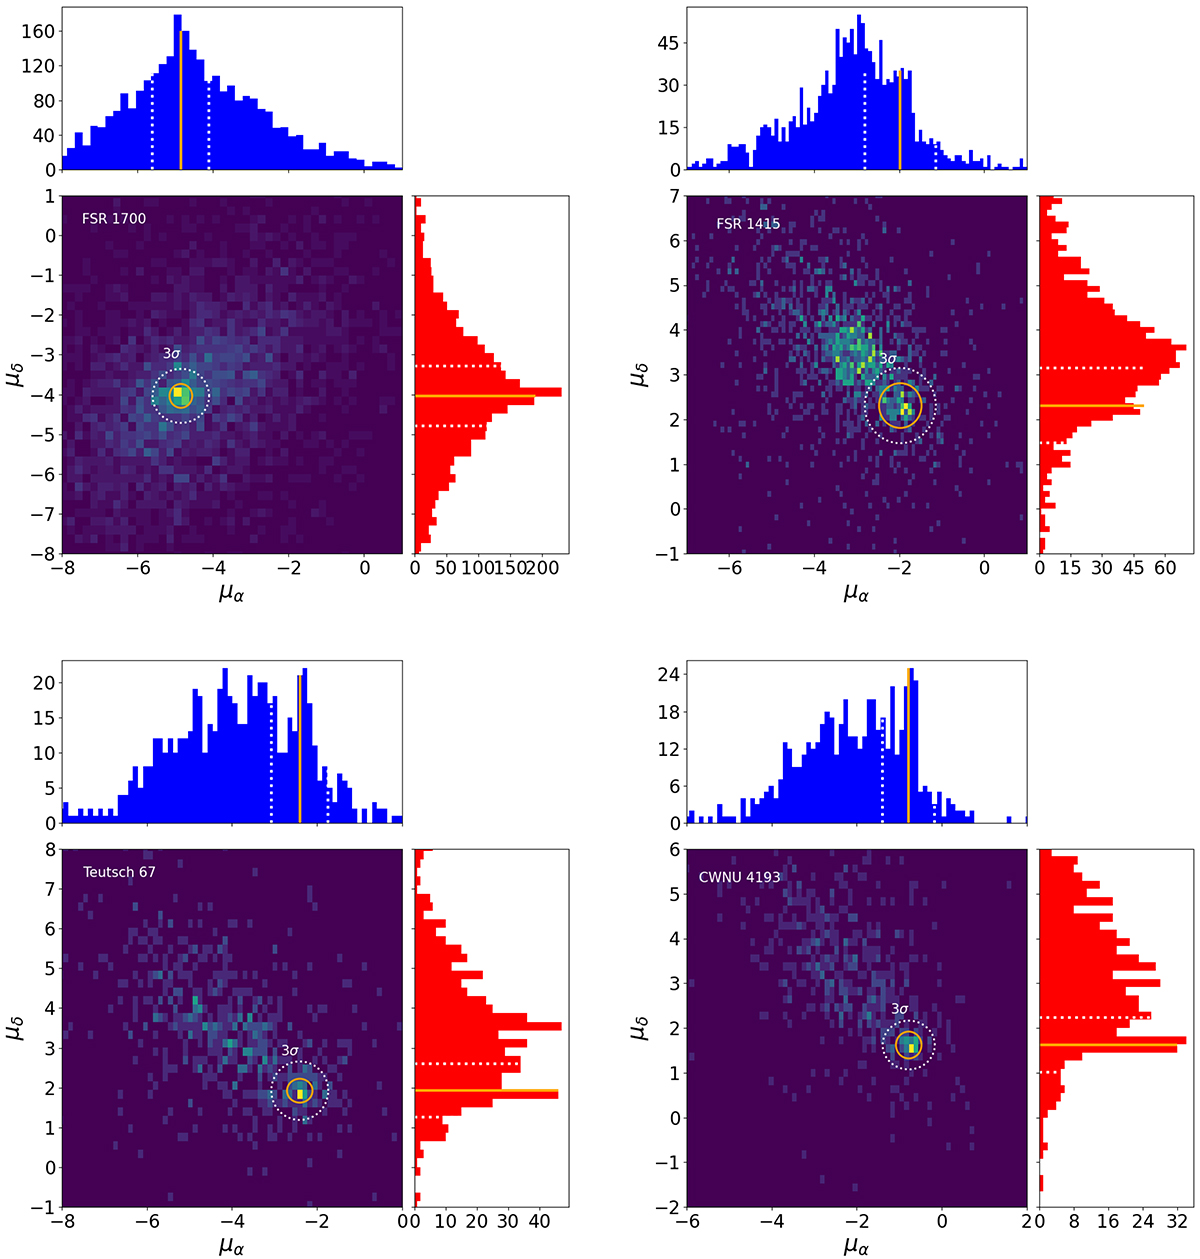
Fig. 2.
Download original image
VPDs of all the stars in the respective cluster sample. VPD is the 2D histogram, along with the separate histograms for PMRA (in blue) and PMDEC (in red). The 3σ boundary centred on the mean cluster PMs is indicated by the dotted white circles. The final selection of the most likely cluster members is made within the 3σ region, depicted by the red circle.
Current usage metrics show cumulative count of Article Views (full-text article views including HTML views, PDF and ePub downloads, according to the available data) and Abstracts Views on Vision4Press platform.
Data correspond to usage on the plateform after 2015. The current usage metrics is available 48-96 hours after online publication and is updated daily on week days.
Initial download of the metrics may take a while.