Fig. 7.
Download original image
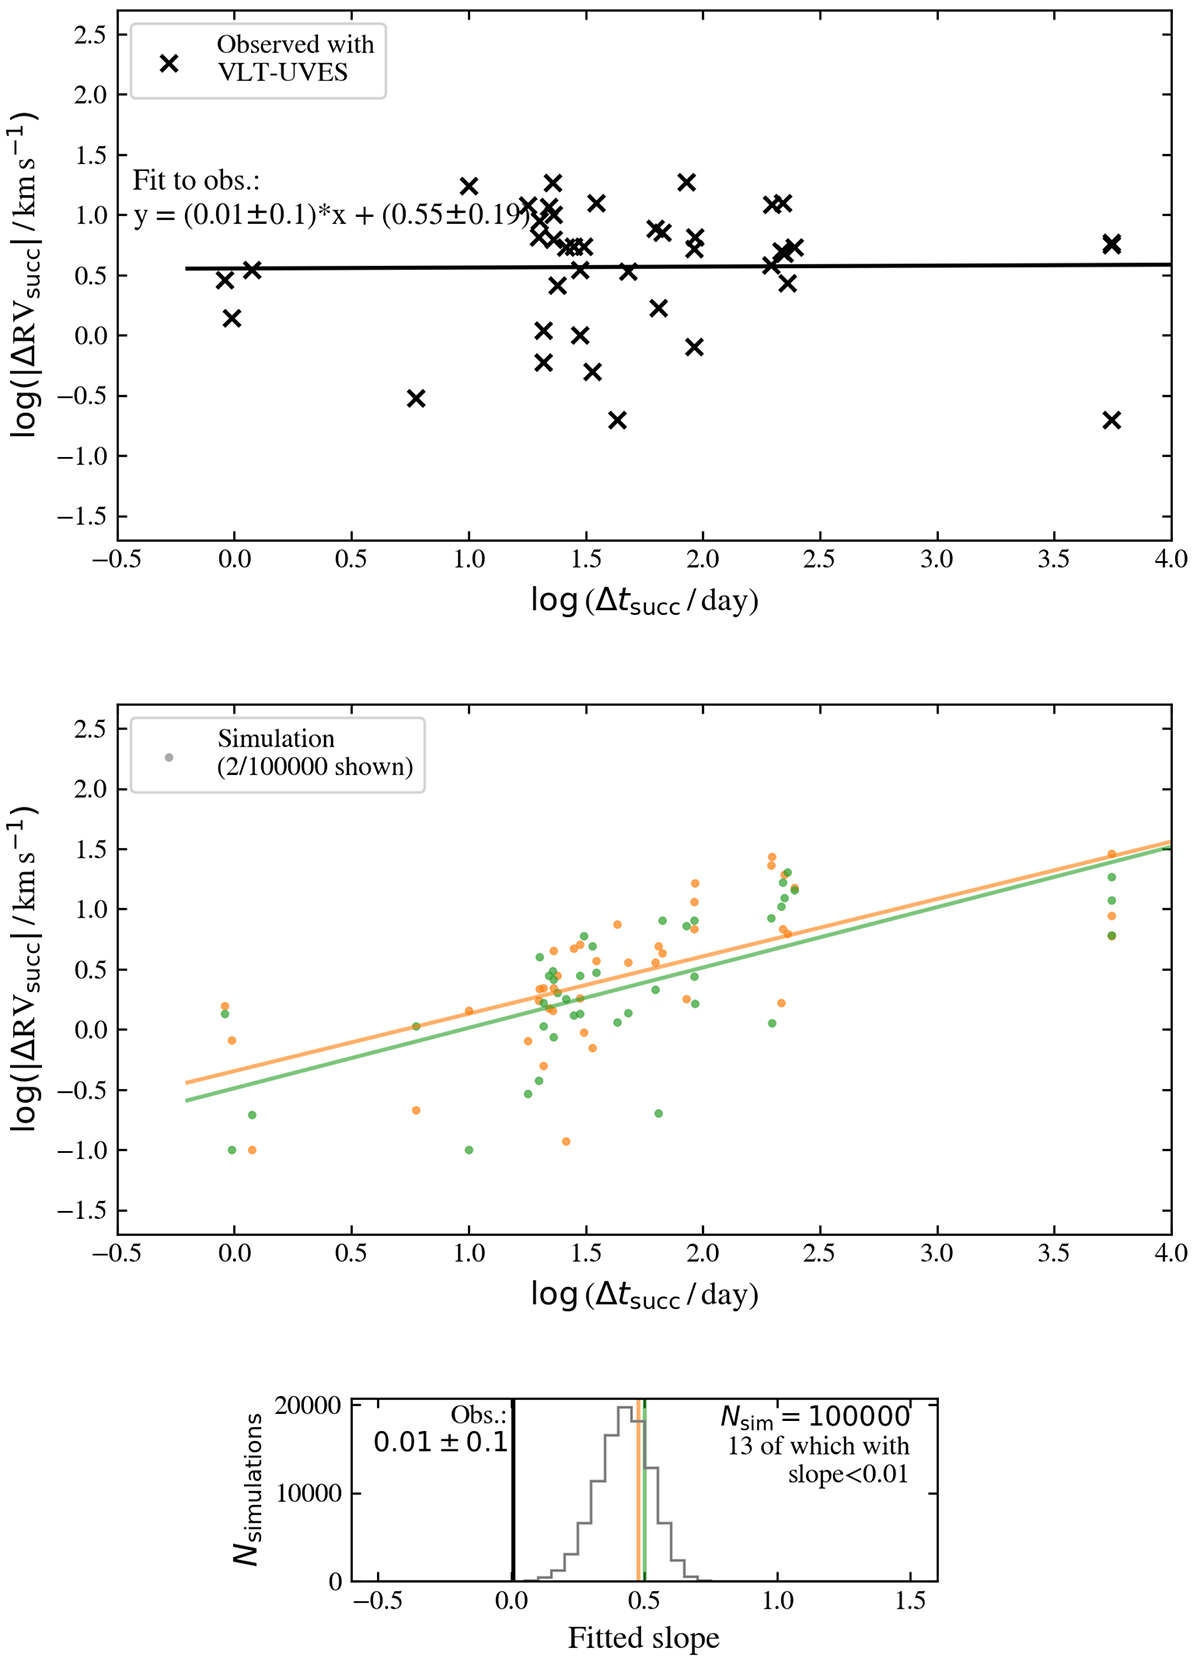
Correlation of the time interval, Δtsucc, between two successive RV measurements and their observed ΔRVsucc. Top: The black crosses represent measurements taken in this work and in Marchenko et al. (2007). Middle: Measurements of a simulated population of long-period binaries with orbital periods between 1 and 10 years (see the main text for details), shown as colored dots. For clarity, we show only 2 of the 100 000 simulated observing campaigns. Bottom: Histogram of the 100 000 fitted slopes. The two vertical lines indicate the values of the two examples shown in the middle panel.
Current usage metrics show cumulative count of Article Views (full-text article views including HTML views, PDF and ePub downloads, according to the available data) and Abstracts Views on Vision4Press platform.
Data correspond to usage on the plateform after 2015. The current usage metrics is available 48-96 hours after online publication and is updated daily on week days.
Initial download of the metrics may take a while.