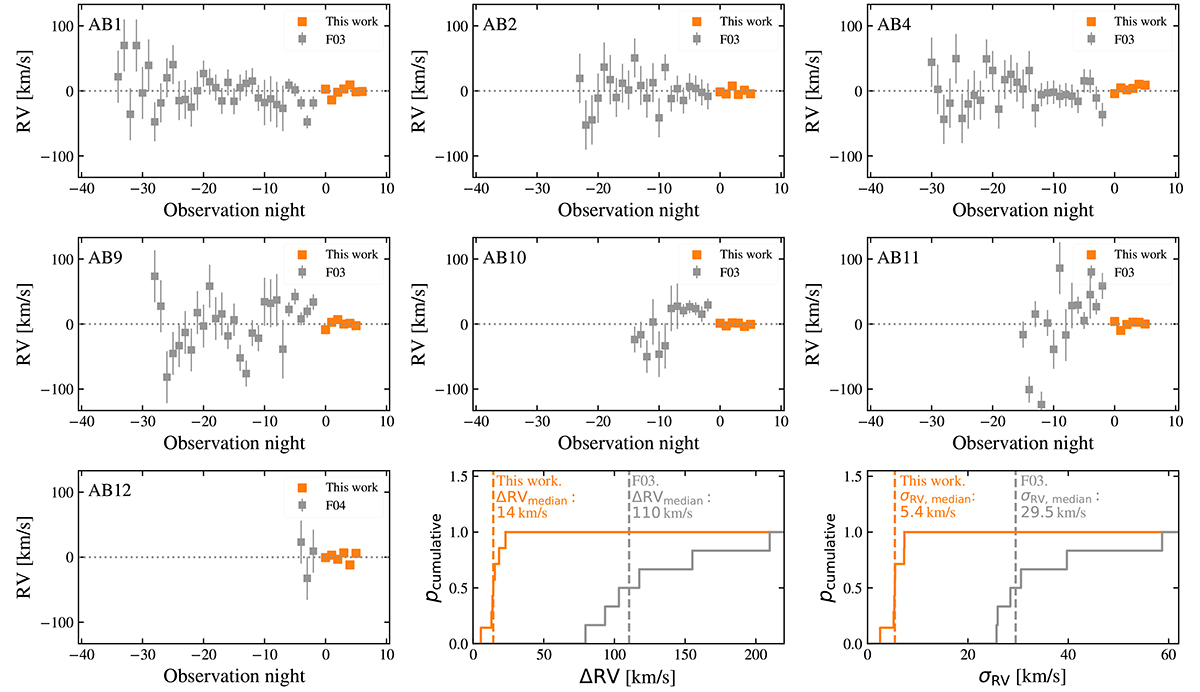
Fig. 4.
Download original image
Similar to Fig. 3, but showing RV measurements from a previous monitoring campaign (F03) and the three previous RV measurements of SMC AB12 from Foellmi (2004). These measurements have been shifted by the previously measured average RV for each star. The center and right plots on the bottom row are cumulative probability distributions.
Current usage metrics show cumulative count of Article Views (full-text article views including HTML views, PDF and ePub downloads, according to the available data) and Abstracts Views on Vision4Press platform.
Data correspond to usage on the plateform after 2015. The current usage metrics is available 48-96 hours after online publication and is updated daily on week days.
Initial download of the metrics may take a while.