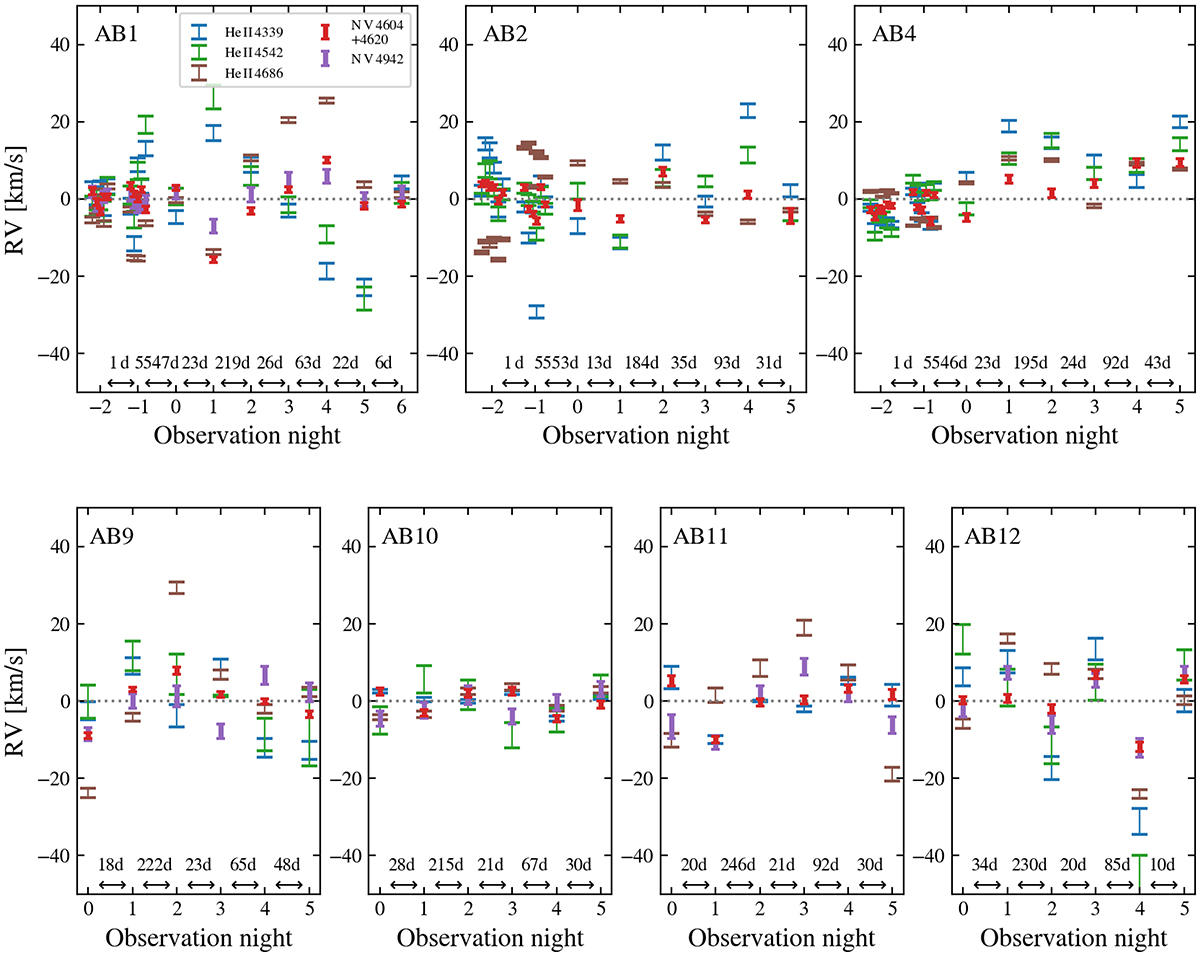
Fig. 3.
Download original image
RV measurements based on UVES spectra taken on different nights. The first of the six spectra of our observing campaign was taken on observation night 0. The time interval in days between different observation nights is written at the bottom of the subplots. For SMC AB1, 2, and 4, we also show measurements based on the preexisting UVES spectra of Marchenko et al. (2007) (they are the data from observation nights −2 and −1). In this work we opted to use the N V lines, which are shown with thicker lines.
Current usage metrics show cumulative count of Article Views (full-text article views including HTML views, PDF and ePub downloads, according to the available data) and Abstracts Views on Vision4Press platform.
Data correspond to usage on the plateform after 2015. The current usage metrics is available 48-96 hours after online publication and is updated daily on week days.
Initial download of the metrics may take a while.