Fig. A.1.
Download original image
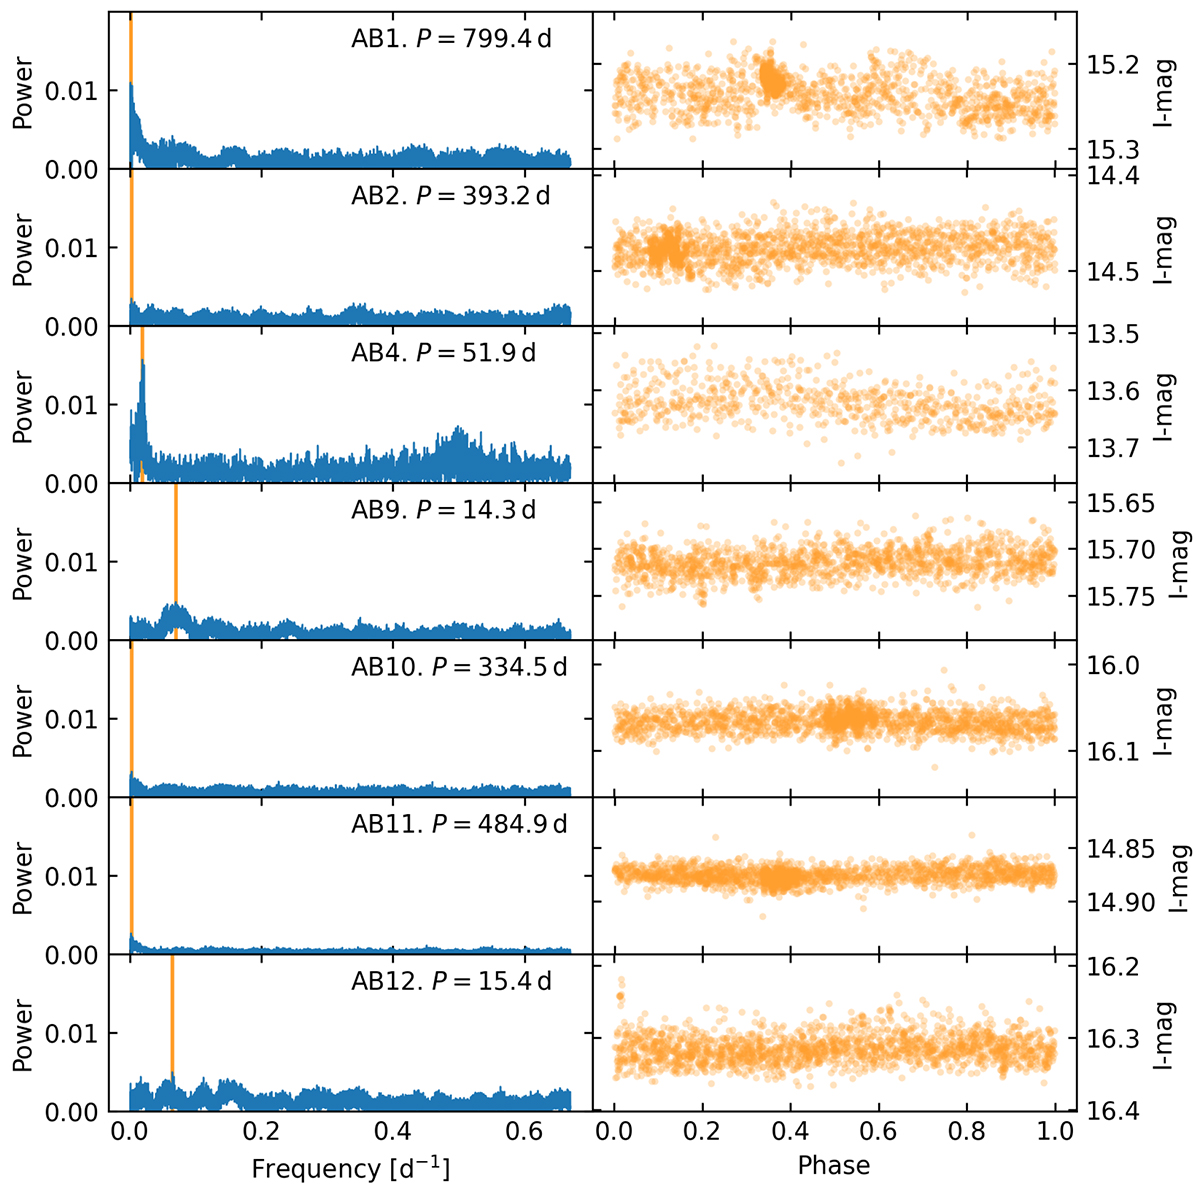
Strongest periodic signals in time-series photometry. Left panels: Lomb-Scargle periodograms of our target stars, based on OGLE data. The orange line shows the frequency at which the highest power is achieved, and the corresponding period is written in each panel. Right panels: Phase-folded light curves of I-band magnitudes, adopting the periods given in the left panels.
Current usage metrics show cumulative count of Article Views (full-text article views including HTML views, PDF and ePub downloads, according to the available data) and Abstracts Views on Vision4Press platform.
Data correspond to usage on the plateform after 2015. The current usage metrics is available 48-96 hours after online publication and is updated daily on week days.
Initial download of the metrics may take a while.