Fig. 1.
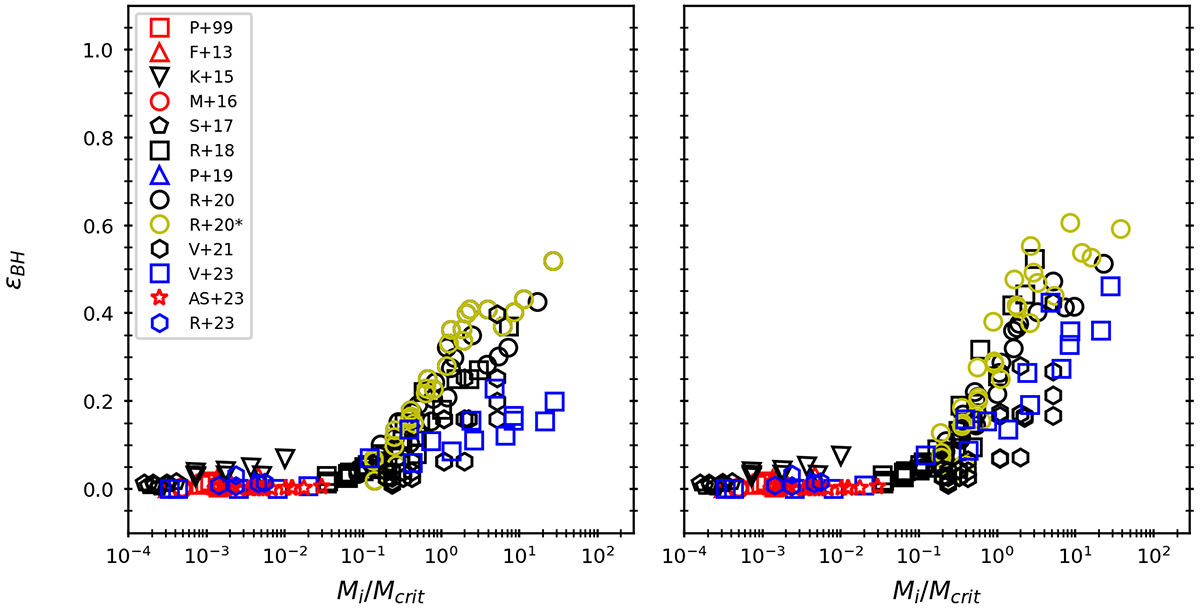
Download original image
Black hole formation efficiency, ϵBH, (left) computed by Eq. (3) against the initial mass of the cluster, Mi, normalized by the critical mass, Mcrit, calculated via Eq. (1). Different types of star clusters are represented by distinct colors: black symbols for the first star clusters (yellow symbols data from Reinoso et al. 2020, represent models with external potential, calculated via Eq. 2), red symbols for GCS and blue symbols for NSCS. The final stellar mass is estimated neglecting mass loss via Eq. (4). Right: The black hole formation efficiency ϵBH computed by Eq. (3) against the current mass of the cluster, Mi, normalized by the critical mass, Mcrit, calculated from Eq. (1), including an approximate correction for mass loss.
Current usage metrics show cumulative count of Article Views (full-text article views including HTML views, PDF and ePub downloads, according to the available data) and Abstracts Views on Vision4Press platform.
Data correspond to usage on the plateform after 2015. The current usage metrics is available 48-96 hours after online publication and is updated daily on week days.
Initial download of the metrics may take a while.