Fig. 9.
Download original image
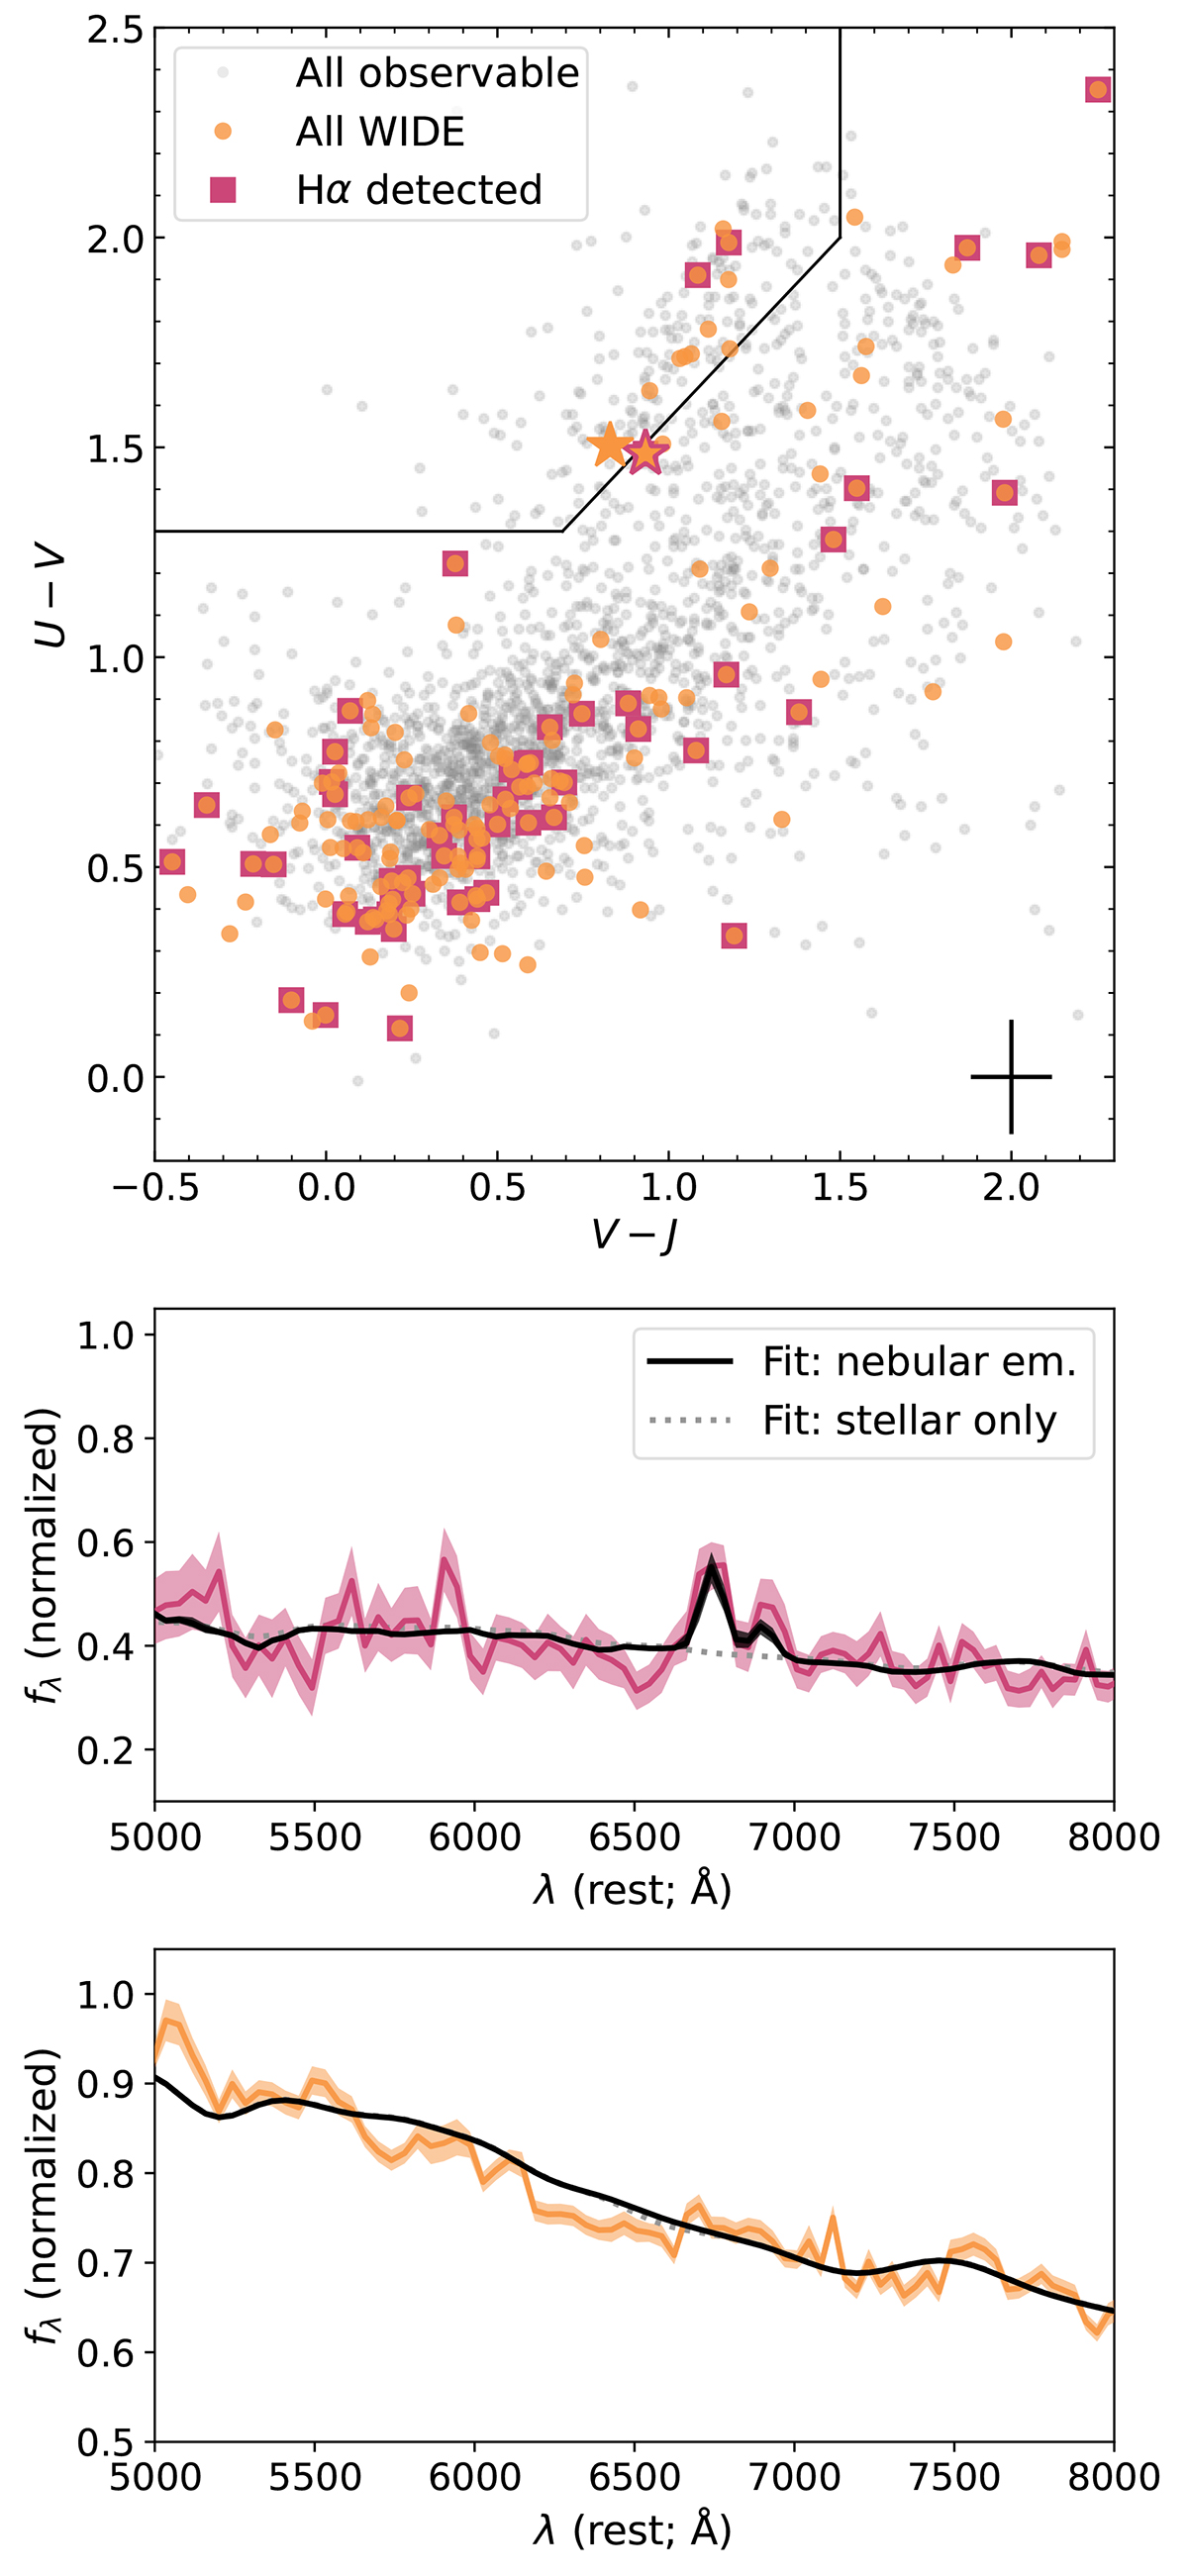
Observed UVJ diagram (Williams et al. 2009), showing restframe U − V and V − J colors (calculated using EAzY; Brammer et al. 2008), for objects at 1.5 < z < 2.4 with M⋆ > 109 M⊙ in the AEGIS pointings of Wide. Upper panel: Solid orange points are the observed sample and transparent grey points are the parent sample. While objects located within the boundary in the upper-left corner are often considered to be quiescent in nature (e.g. Whitaker et al. 2011; Muzzin et al. 2013), Wide spectroscopy reveals Hα emission in some of them (squares) indicating some source of ionizing photons (e.g. residual star formation, heating by old stellar populations, and/or an AGN; Byler et al. 2019; Maseda et al. 2021). Lower panels: Wide PRISM spectra for the two objects denoted by stars in the upper panel; sources close to the boundary between star-forming and quiescent. While the characteristic uncertainty in the restframe colors is large (shown in the lower-right corner of the upper panel), spectroscopy can unambiguously differentiate via e.g. a detection of Hα emission at 6563 Å in excess of the BAGPIPES-determined stellar continuum.
Current usage metrics show cumulative count of Article Views (full-text article views including HTML views, PDF and ePub downloads, according to the available data) and Abstracts Views on Vision4Press platform.
Data correspond to usage on the plateform after 2015. The current usage metrics is available 48-96 hours after online publication and is updated daily on week days.
Initial download of the metrics may take a while.