Fig. 8.
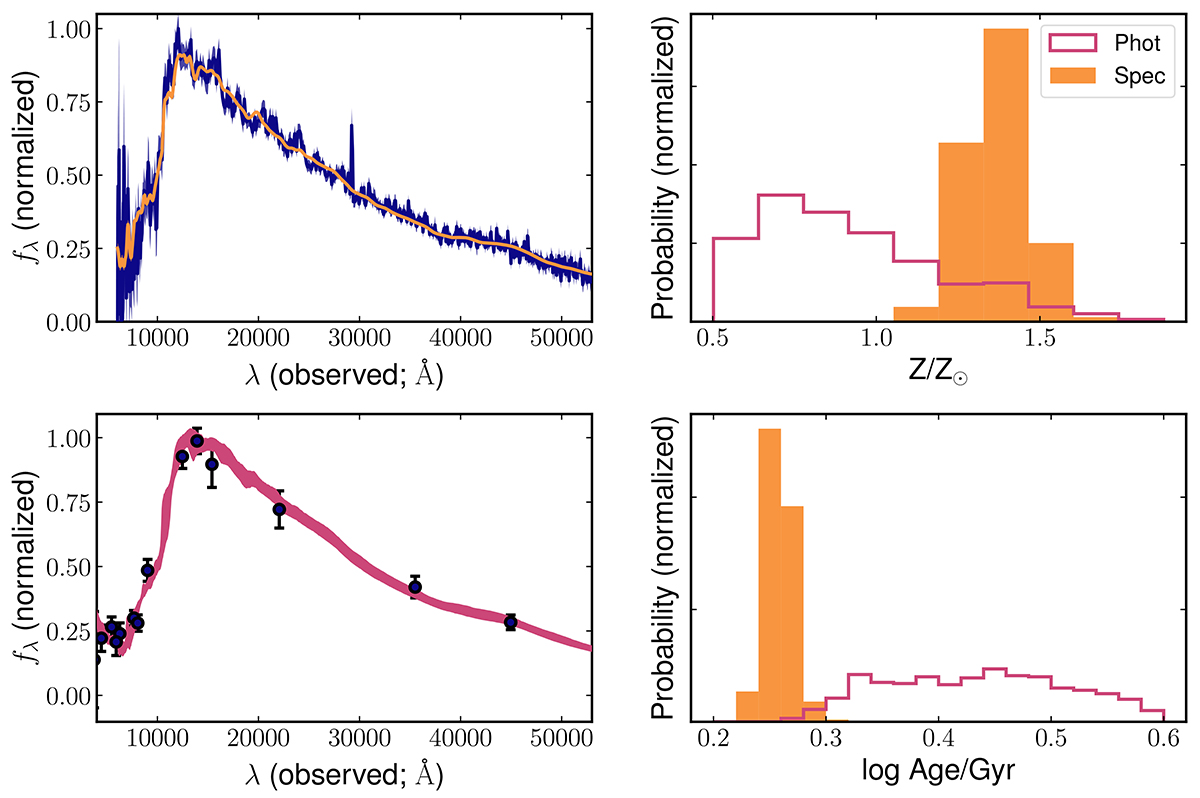
Download original image
Example PRISM spectrum (top left) and photometry (bottom left) for a galaxy in the Wide survey (3D-HST ID: UDS 22634). Both the spectrum and the photometry are fit with Bagpipes (Carnall et al. 2018, 2019), with the best-fit models and their dispersion overplotted. The right panels show posterior probability distributions for the stellar metallicity (top right) and age (bottom right) for an exponentially declining star formation history. The spectroscopic fit (filled histogram) results in better-constrained posteriors with a significantly different physical interpretation than would be possible with photometry alone (see also Kriek et al. 2006).
Current usage metrics show cumulative count of Article Views (full-text article views including HTML views, PDF and ePub downloads, according to the available data) and Abstracts Views on Vision4Press platform.
Data correspond to usage on the plateform after 2015. The current usage metrics is available 48-96 hours after online publication and is updated daily on week days.
Initial download of the metrics may take a while.