Open Access
Fig. 4.
Download original image
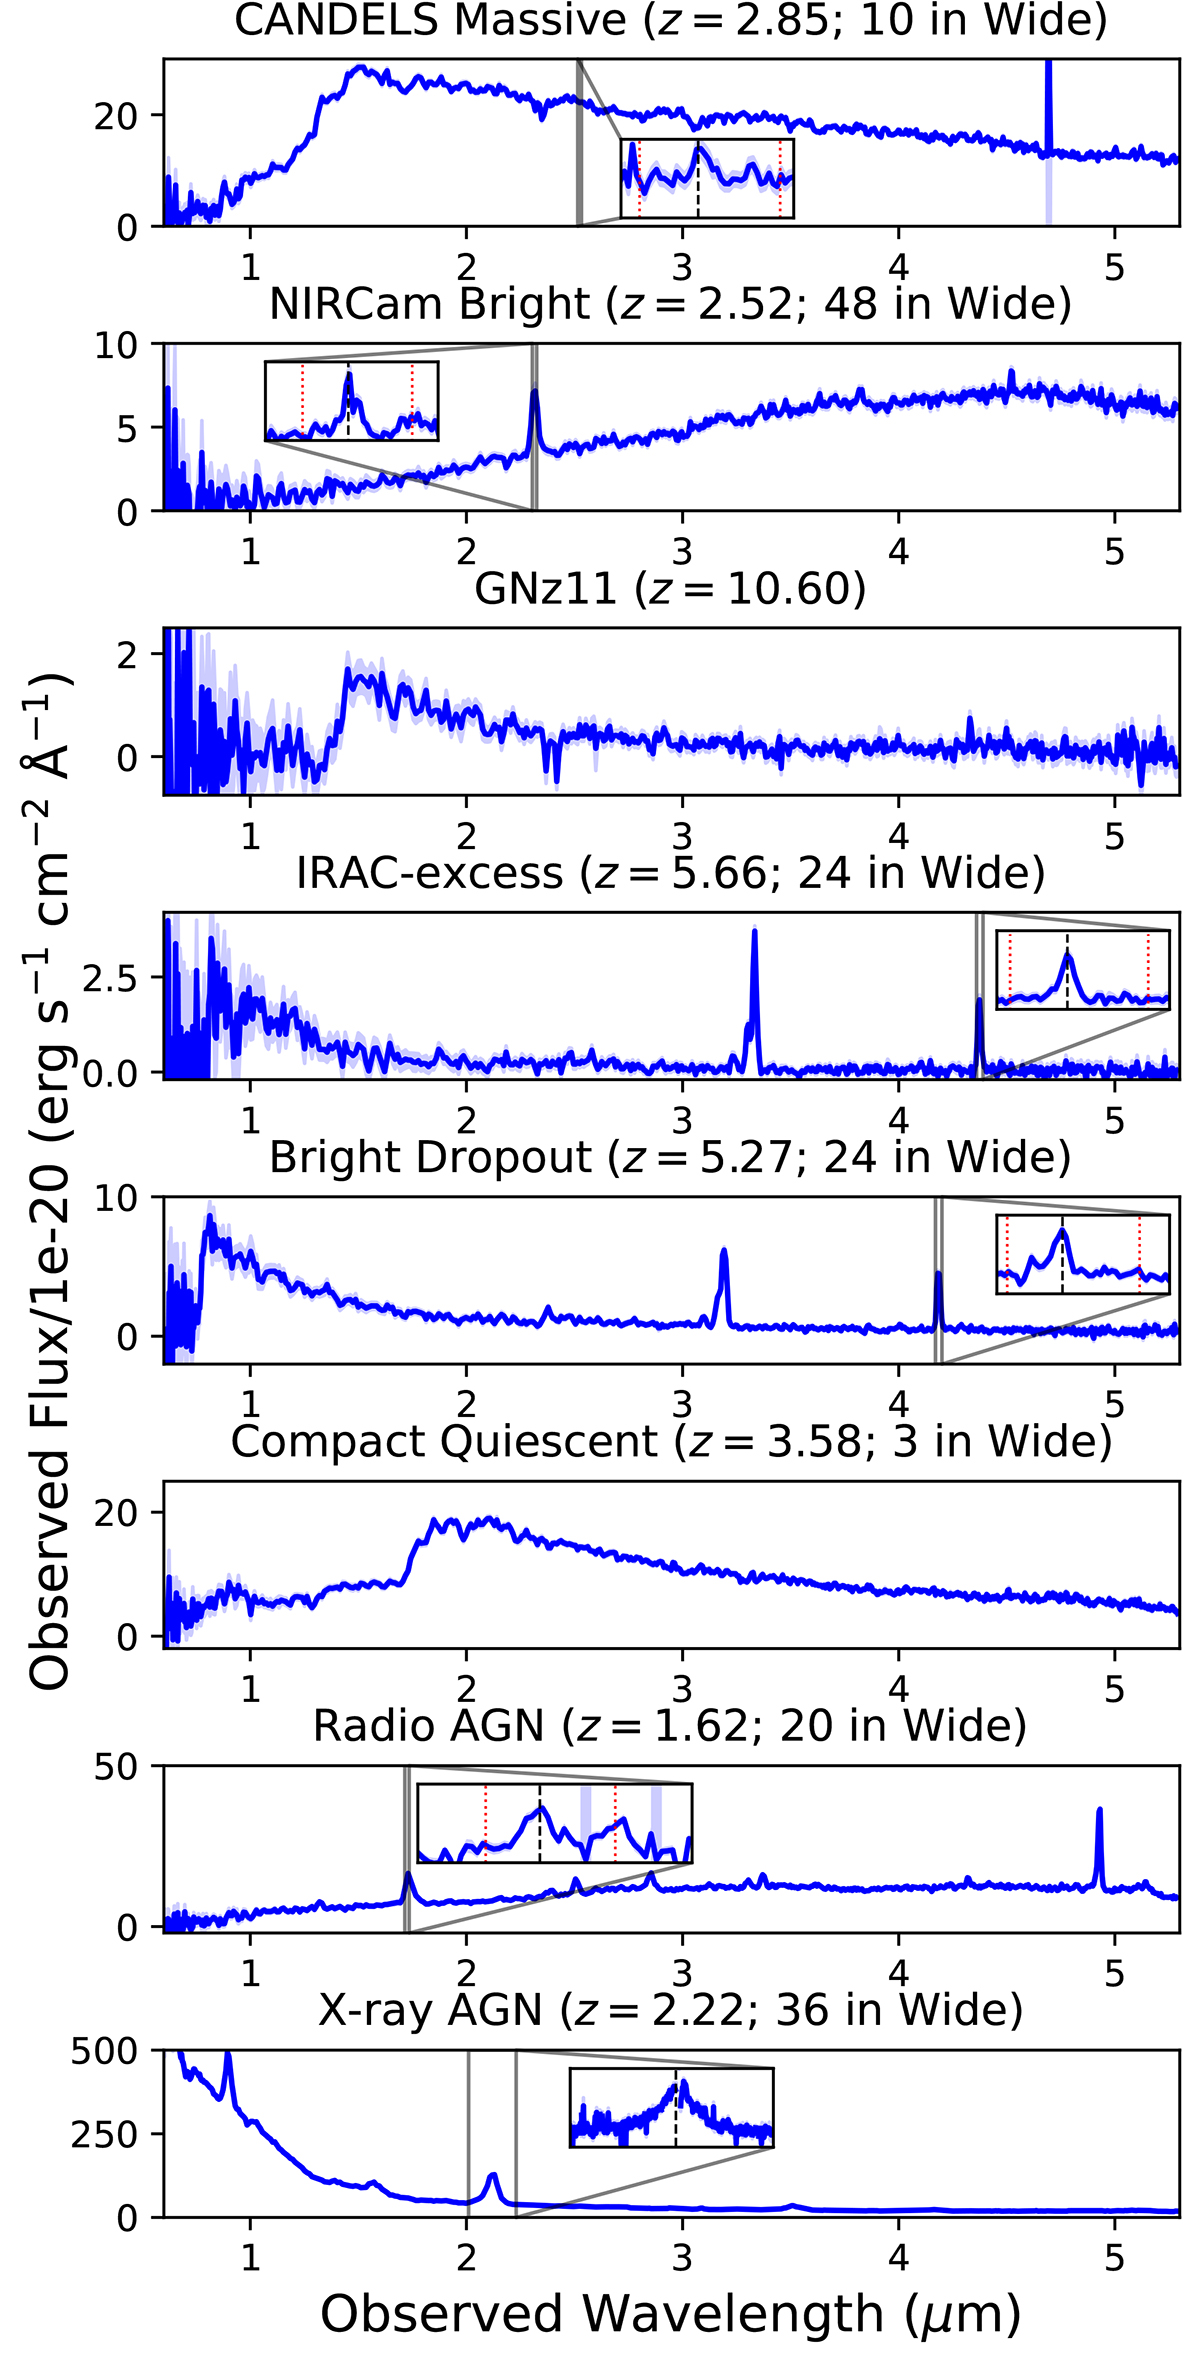
Example PRISM spectra for objects in each of the highest-priority “P1” categories (Section 3.1), including the unique number observed in the survey when applicable. Inset figures show high-resolution data covering Hα (vertical dashed lines) and [N II] (vertical dotted lines), when detected.
Current usage metrics show cumulative count of Article Views (full-text article views including HTML views, PDF and ePub downloads, according to the available data) and Abstracts Views on Vision4Press platform.
Data correspond to usage on the plateform after 2015. The current usage metrics is available 48-96 hours after online publication and is updated daily on week days.
Initial download of the metrics may take a while.