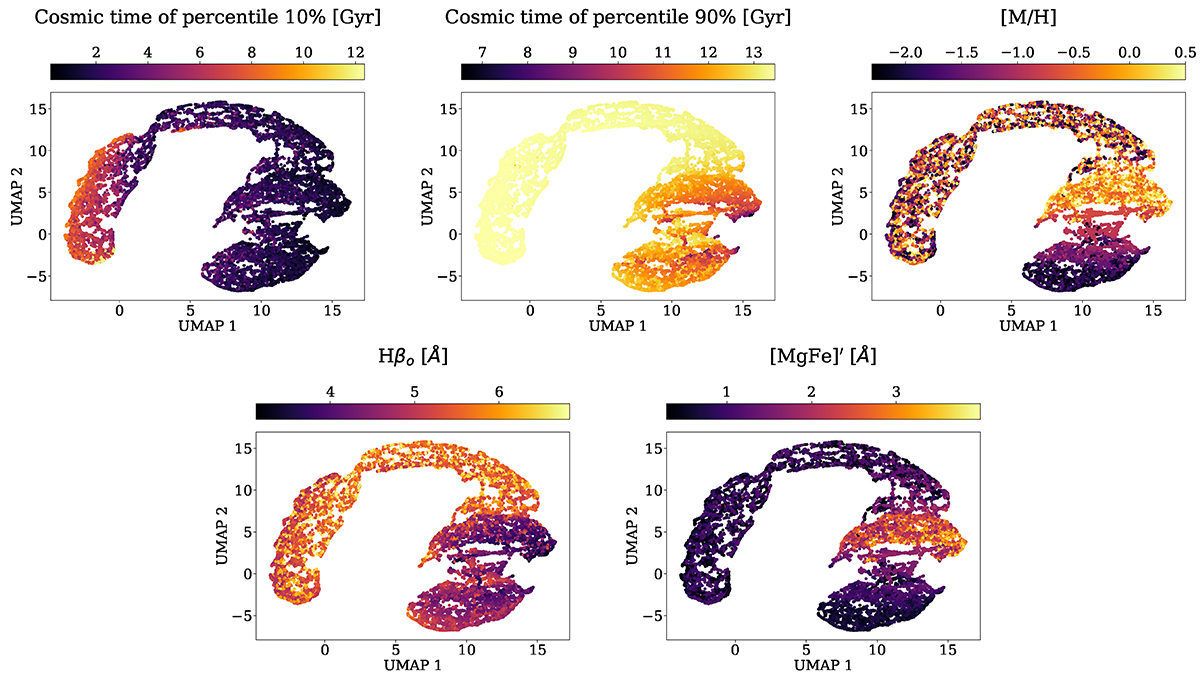
Fig. A.1.
Download original image
UMAP embedding for the latent representations. Each dot corresponds to a synthetic galaxy from the test sample. The closer two galaxies are on the map, the more similar are their latent representations. Different colour maps are set according to the cosmic time at which 10% (top left) and 90% (top middle) of the total stellar mass is reached, the [M/H] (top right), and the two line indices Hβo (lower left) and [MgFe]′ (lower right). Clear trends can be observed, demonstrating that the information encoded in the latent vectors is optimal for recovering the SFHs and metallicities.
Current usage metrics show cumulative count of Article Views (full-text article views including HTML views, PDF and ePub downloads, according to the available data) and Abstracts Views on Vision4Press platform.
Data correspond to usage on the plateform after 2015. The current usage metrics is available 48-96 hours after online publication and is updated daily on week days.
Initial download of the metrics may take a while.