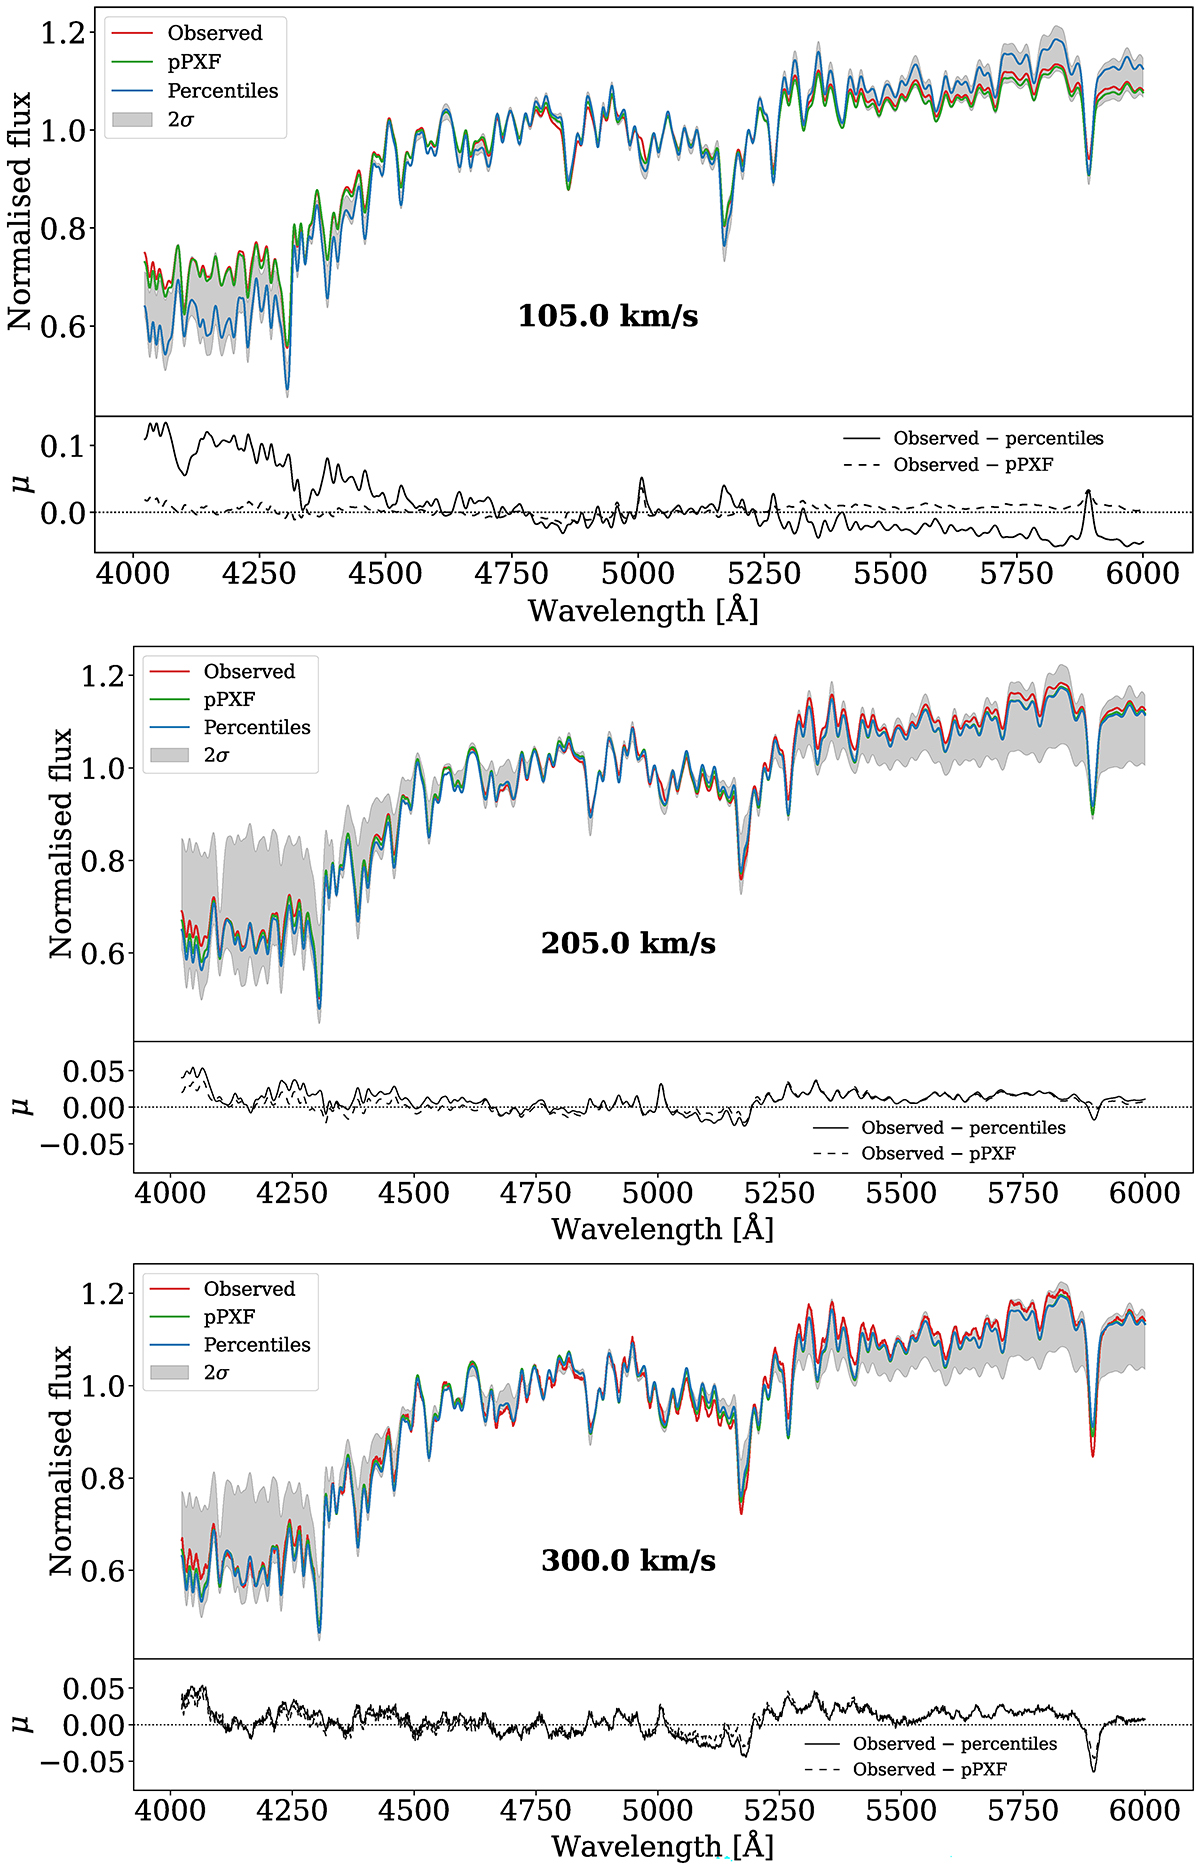
Fig. 8.
Download original image
Reconstructions of the observed spectra for the stacks with velocity dispersion 105, 205, and 300 km s−1. In red we show the observed spectra, normalised by the median, in the wavelength range [4023, 6000] Å. In blue, we show the spectra obtained as a linear combination of MILES SSP spectra according to our model, using the median values of the posteriors predicted. We repeated the procedure for the median ±2σ to get the grey-shadowed stripe, which shows how the uncertainties in the quantities are manifested in the spectra. In green, we plot the spectra obtained with the weights given by pPXF. In the lower panels, we include the residuals between the observed spectra and those reconstructed from the percentiles and metallicity predicted by our model (solid black line), and between the observed spectra and the one recovered by pPXF (dashed black line). The dotted line indicates the zero level. The typical value of the residuals of our method (1.7%) is very similar to the average value obtained with pPXF (1.5%), although in the first case the inference is performed in the latent space, without directly trying to reproduce the observed spectra.
Current usage metrics show cumulative count of Article Views (full-text article views including HTML views, PDF and ePub downloads, according to the available data) and Abstracts Views on Vision4Press platform.
Data correspond to usage on the plateform after 2015. The current usage metrics is available 48-96 hours after online publication and is updated daily on week days.
Initial download of the metrics may take a while.