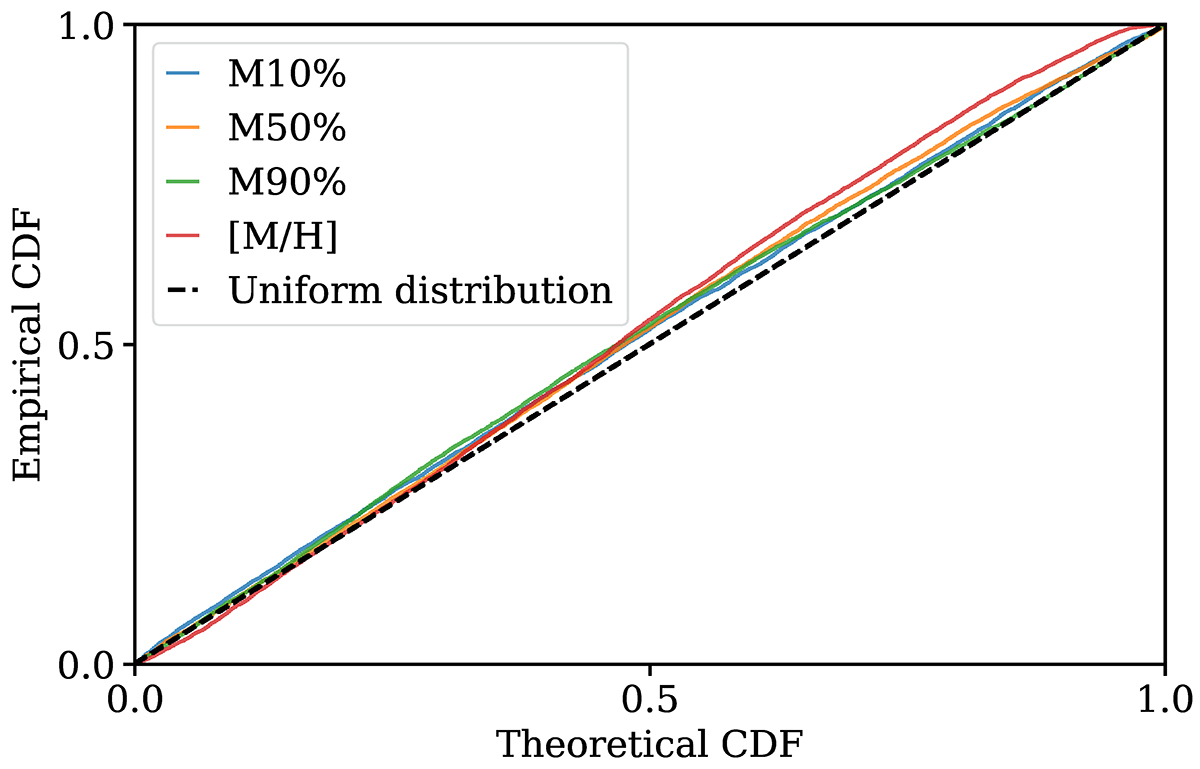
Fig. 6.
Download original image
Empirical CDFs for the percentiles 10%, 50%, and 90% and for the [M/H] obtained with 1000 synthetic test observations. If the posteriors are well calibrated, the nominal coverage probability (the fraction of the probability volume), on the x-axis, will be equal to the coverage probability (the fraction of actual values in such a volume), on the y-axis, making the CDF diagonal (dashed black line). Our CDFs closely follow the diagonal, indicating that the posteriors are properly computed.
Current usage metrics show cumulative count of Article Views (full-text article views including HTML views, PDF and ePub downloads, according to the available data) and Abstracts Views on Vision4Press platform.
Data correspond to usage on the plateform after 2015. The current usage metrics is available 48-96 hours after online publication and is updated daily on week days.
Initial download of the metrics may take a while.