Fig. 5.
Download original image
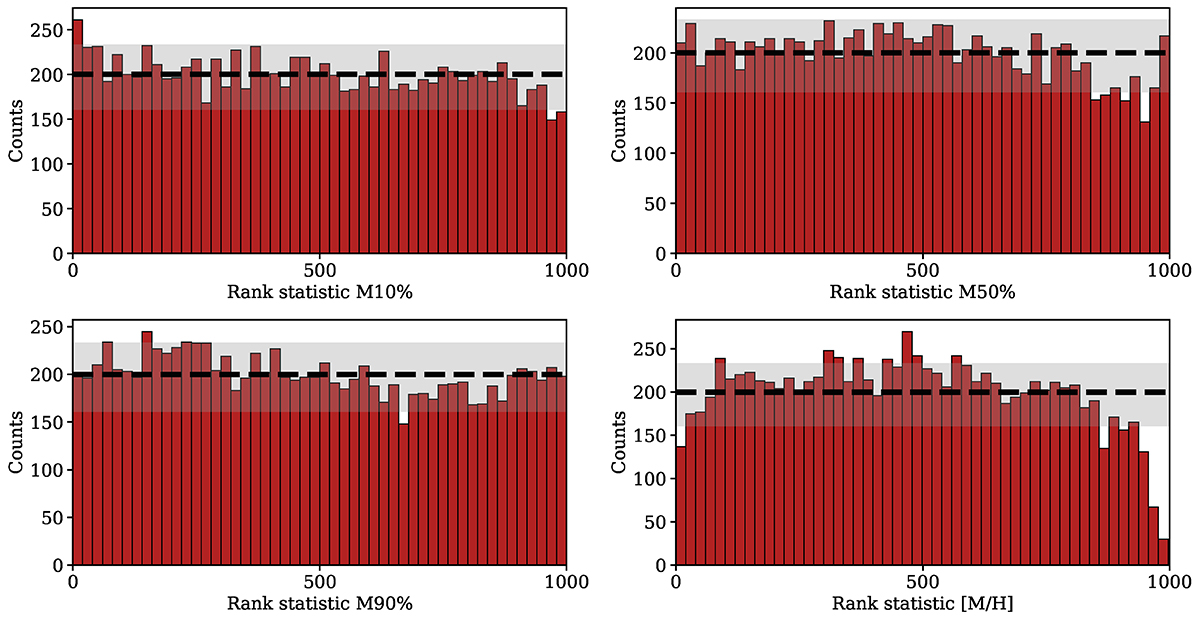
SBC test of the posteriors for 1000 synthetic test observations. The red histograms in each panel represent the distribution of the rank statistic of the true value within the marginalised posterior for the percentiles 10%, 50%, and 90% and for [M/H]. For a well-calibrated posterior, the rank statistics will have a uniform distribution (dashed black line). The grey band indicates 99% of the variation expected from a uniform histogram. The rank statistic distributions of our posteriors are nearly uniform for all four parameters, and therefore, the model provides unbiased and accurate posteriors.
Current usage metrics show cumulative count of Article Views (full-text article views including HTML views, PDF and ePub downloads, according to the available data) and Abstracts Views on Vision4Press platform.
Data correspond to usage on the plateform after 2015. The current usage metrics is available 48-96 hours after online publication and is updated daily on week days.
Initial download of the metrics may take a while.