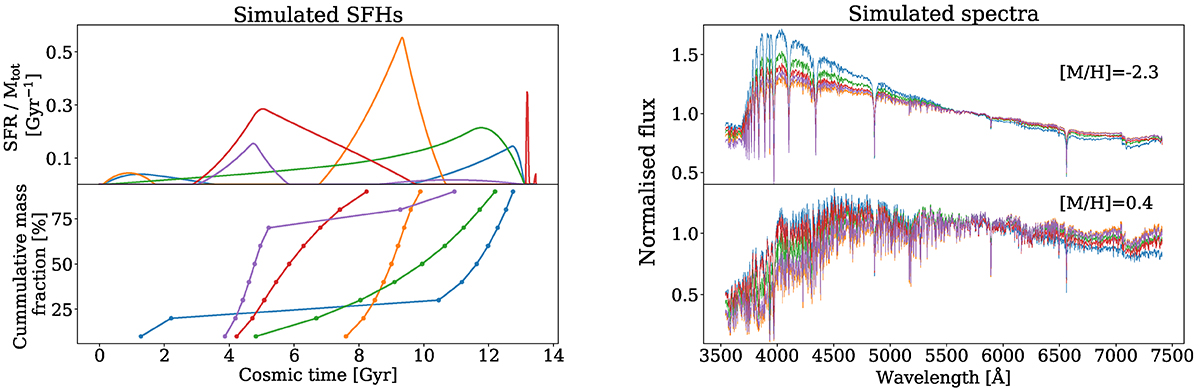
Fig. 1.
Download original image
Samples of the simulated dataset, each in a different colour. In the left plot we show their mocked SFHs: in the upper panel the star formation rate normalised by the total stellar mass in Gyr−1 and in the lower one the nine stellar mass percentiles, together with three dashed grey lines indicating when 25%, 50%, and 75% of the total stellar mass has been formed. In the right plot, we show the simulated normalised spectra corresponding to these SFHs (same colours) for two different values of metallicity: in the upper panel we fix [M/H] = −2.3, and in the lower one [M/H] = 0.4, which are respectively the minimum and maximum bins of [M/H] in the simulation.
Current usage metrics show cumulative count of Article Views (full-text article views including HTML views, PDF and ePub downloads, according to the available data) and Abstracts Views on Vision4Press platform.
Data correspond to usage on the plateform after 2015. The current usage metrics is available 48-96 hours after online publication and is updated daily on week days.
Initial download of the metrics may take a while.