Fig. 4.
Download original image
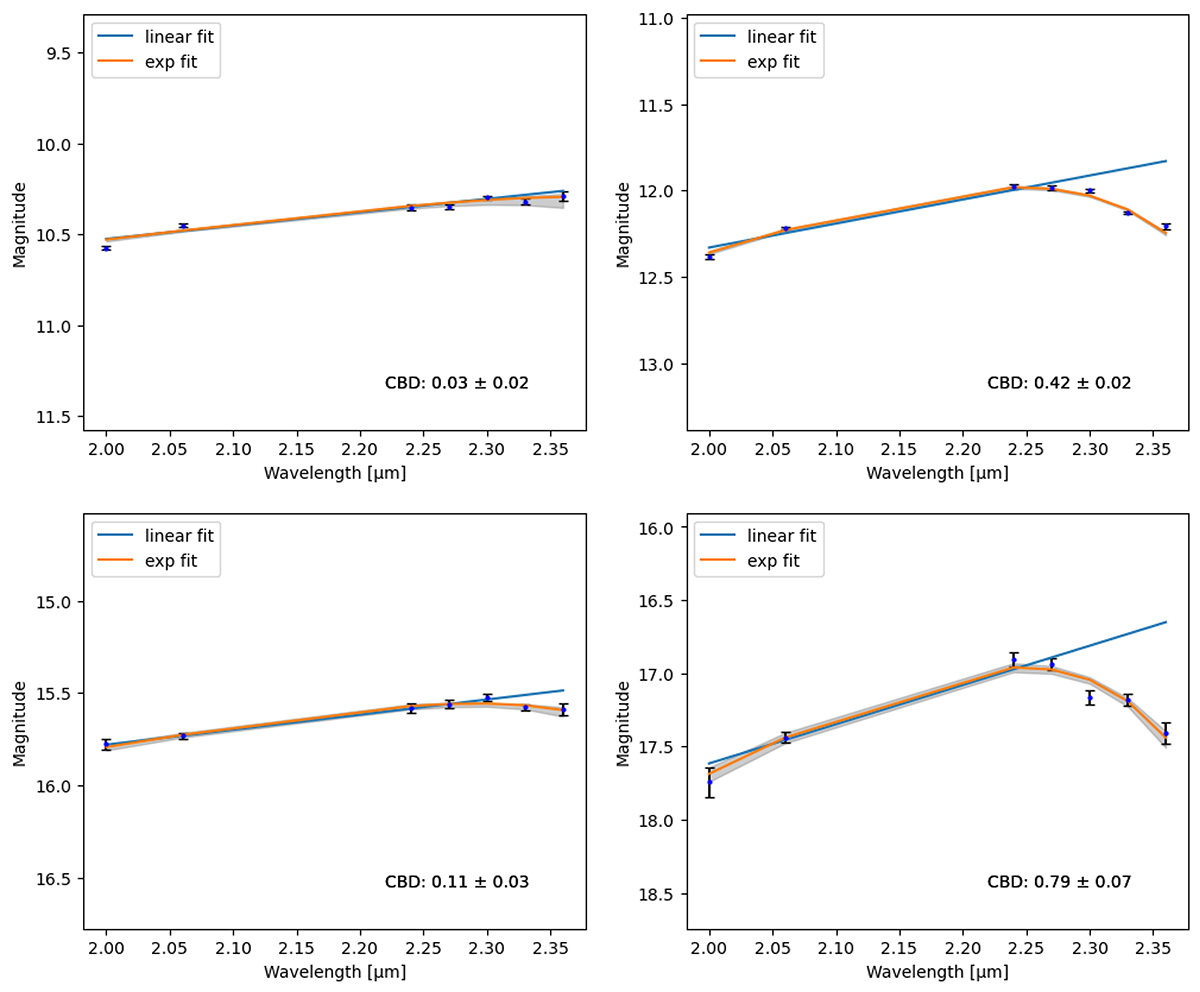
SEDs of four spectroscopically classified stars. The top panel displays bright stars, and the bottom panel shows faint stars, with early-type stars on the left and late-type stars on the right. The blue lines denote the linear fit to the first four data points, while the orange lines represent the exponential fit to all seven data points. The grey shadows indicate the uncertainties of the exponential fits, as obtained from Monte Carlo simulations. The panels include notations for the CBDs for the stars.
Current usage metrics show cumulative count of Article Views (full-text article views including HTML views, PDF and ePub downloads, according to the available data) and Abstracts Views on Vision4Press platform.
Data correspond to usage on the plateform after 2015. The current usage metrics is available 48-96 hours after online publication and is updated daily on week days.
Initial download of the metrics may take a while.