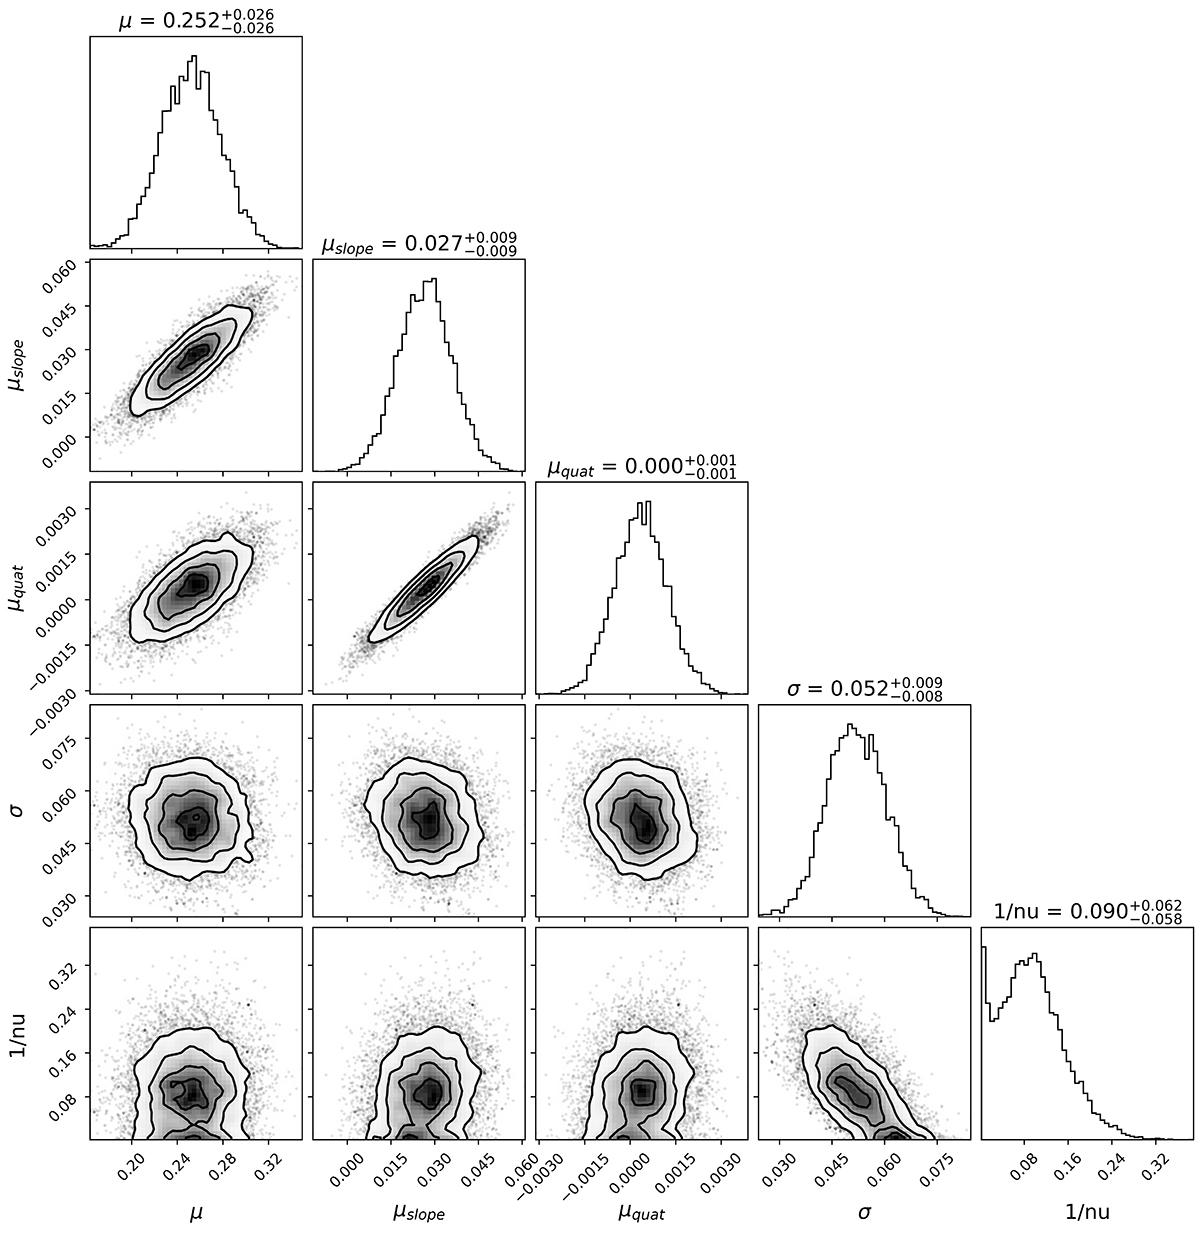
Fig. G.3.
Download original image
Corner plot displaying the fit for early-type stars which employs a Student-t distribution. In this context, ν parameterizes the deviation from a normal distribution and is equivalent to a normal distribution when ν = ∞. By visualizing 1/ν, the transition to a normal distribution becomes more apparent and requires less space. It is important to underscore that the scale parameter σ shares the same interpretation as the variance parameter in a normal distribution only when ν = ∞. The mean intercept μ is here defined at 19.5 mag and has a strong prior. This prevents the mean CBD of early stars from being larger than that of late stars, which is highly implausible.
Current usage metrics show cumulative count of Article Views (full-text article views including HTML views, PDF and ePub downloads, according to the available data) and Abstracts Views on Vision4Press platform.
Data correspond to usage on the plateform after 2015. The current usage metrics is available 48-96 hours after online publication and is updated daily on week days.
Initial download of the metrics may take a while.