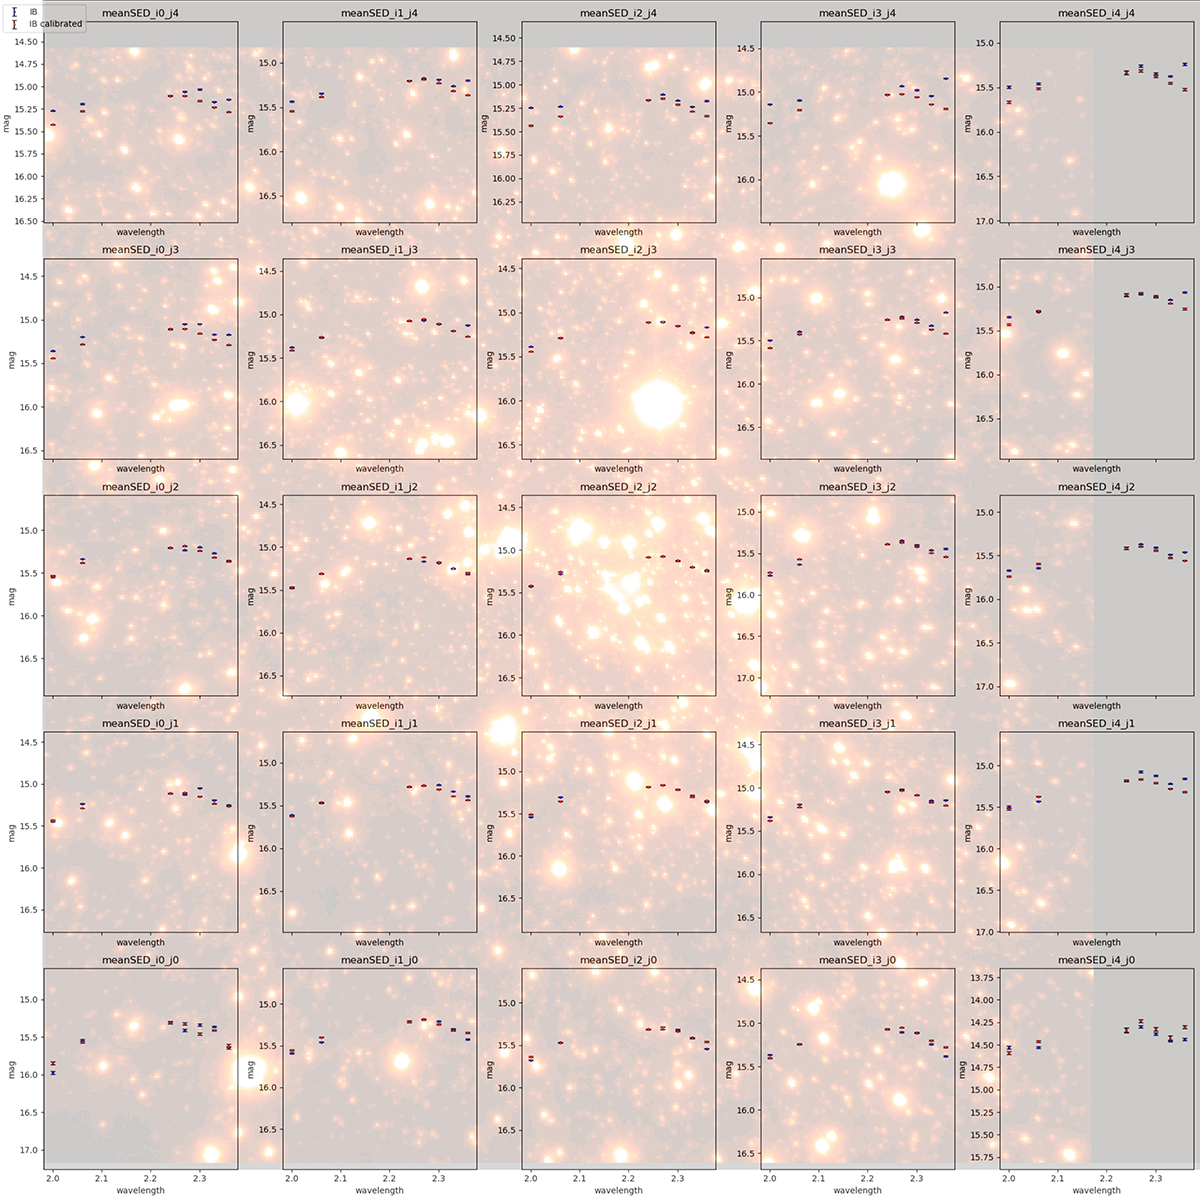
Fig. C.1.
Download original image
Comparison between the mean SED of RC stars in the different sub-fields using the IB data after the basic calibration (blue points) and after applying the local calibration (red points). The SEDs are shifted in magnitude to achieve overlap. The effect of the local calibration is more important in the outer regions. The size of each sub-field is around 8.6″ x 8.6″. The panels corresponding to the different sub-fields overlap with the specific sub-field in the background image.
Current usage metrics show cumulative count of Article Views (full-text article views including HTML views, PDF and ePub downloads, according to the available data) and Abstracts Views on Vision4Press platform.
Data correspond to usage on the plateform after 2015. The current usage metrics is available 48-96 hours after online publication and is updated daily on week days.
Initial download of the metrics may take a while.