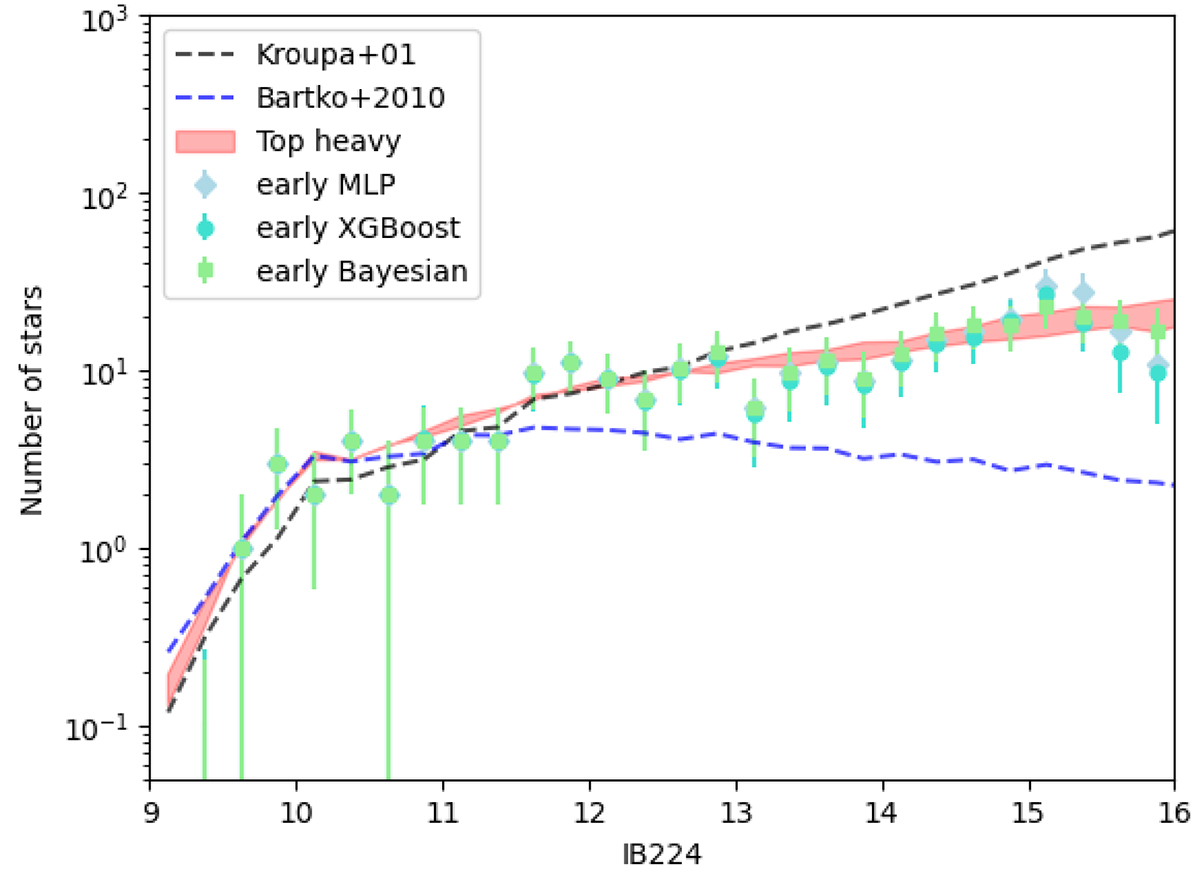
Fig. 20.
Download original image
Comparison between different models simulated with SPISEA and the observed KLF for the different methods summing up probabilities and corrected by completeness (see Section 6.2). The red line represents the KLF corresponding to a simulated cluster with the optimal power-law IMF, featuring an IMF slope of −1.6, while the shaded region indicates the uncertainty in the model. Additionally, the KLFs of cluster models computed with SPISEA using the Kroupa IMF (Kroupa 2001) and employing a top-heavy IMF (Bartko et al. 2010) are presented for comparison.
Current usage metrics show cumulative count of Article Views (full-text article views including HTML views, PDF and ePub downloads, according to the available data) and Abstracts Views on Vision4Press platform.
Data correspond to usage on the plateform after 2015. The current usage metrics is available 48-96 hours after online publication and is updated daily on week days.
Initial download of the metrics may take a while.