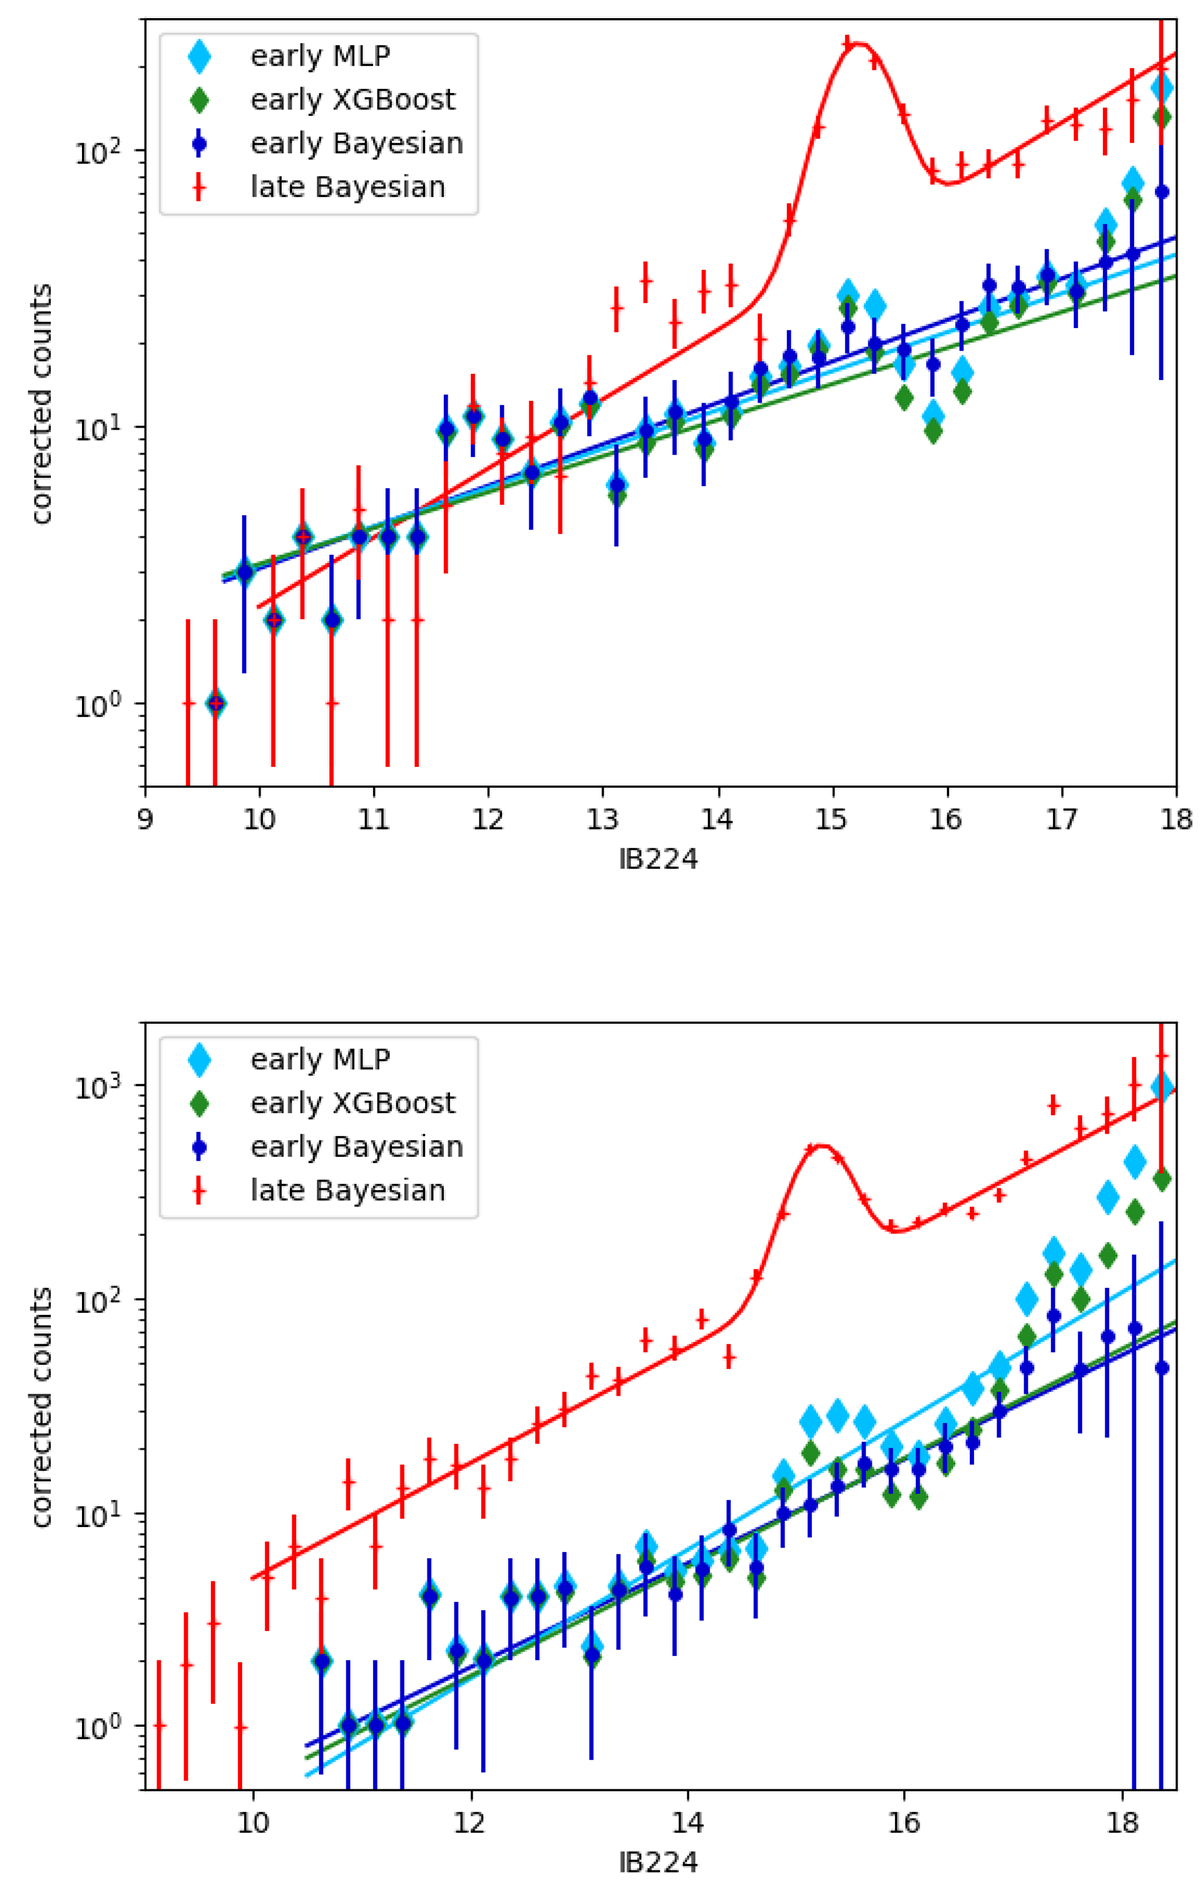
Fig. 15.
Download original image
Completeness corrected luminosity function and fits. The dataset is divided into two regions: R ≤ 9″ (top) and R > 9″ (bottom) to search for potential differences. The fits exclude the brightest bins where there is some deviation from linearity, with the count differing in the centre and further outside. Notably, for the dominating late component, the different algorithms produce very similar results.
Current usage metrics show cumulative count of Article Views (full-text article views including HTML views, PDF and ePub downloads, according to the available data) and Abstracts Views on Vision4Press platform.
Data correspond to usage on the plateform after 2015. The current usage metrics is available 48-96 hours after online publication and is updated daily on week days.
Initial download of the metrics may take a while.