Fig. 13.
Download original image
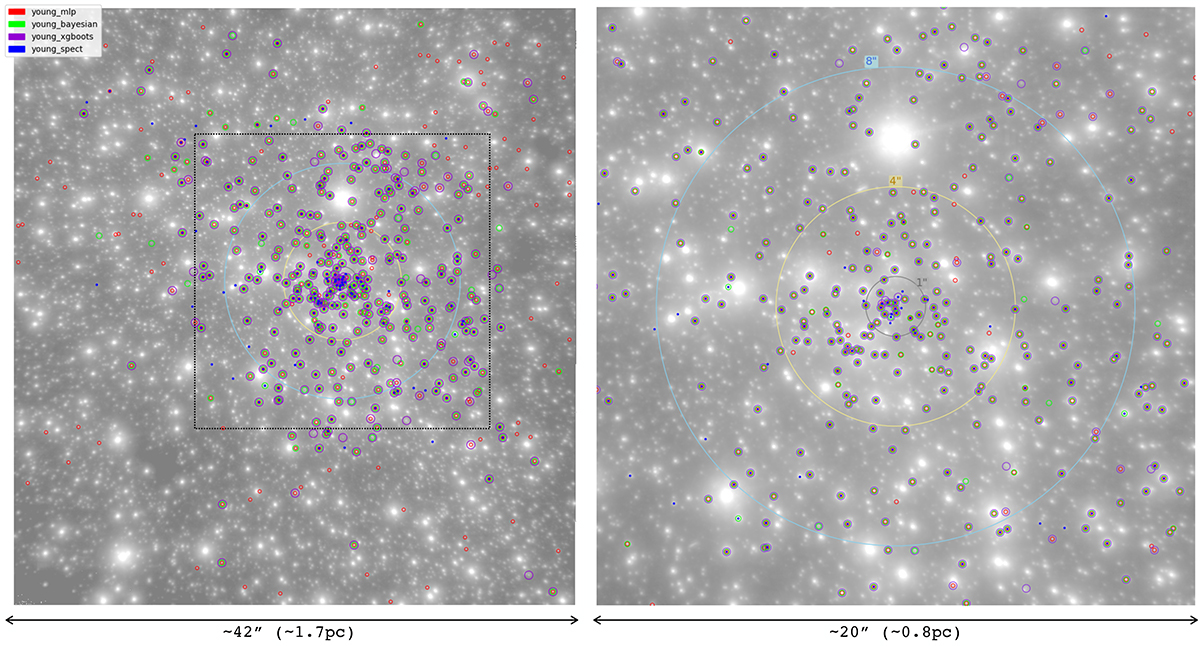
Map illustrating the positions of spectroscopically classified stars (blue points) and early-type candidates brighter than 16 mag for the different methods, superimposed on the image from 12 June 2004. The three distinct regions, as identified in von Fellenberg et al. (2022), are delineated by circles in the images. The right hand panel shows a zoom into the central 20″, marked by the black square on the left.
Current usage metrics show cumulative count of Article Views (full-text article views including HTML views, PDF and ePub downloads, according to the available data) and Abstracts Views on Vision4Press platform.
Data correspond to usage on the plateform after 2015. The current usage metrics is available 48-96 hours after online publication and is updated daily on week days.
Initial download of the metrics may take a while.