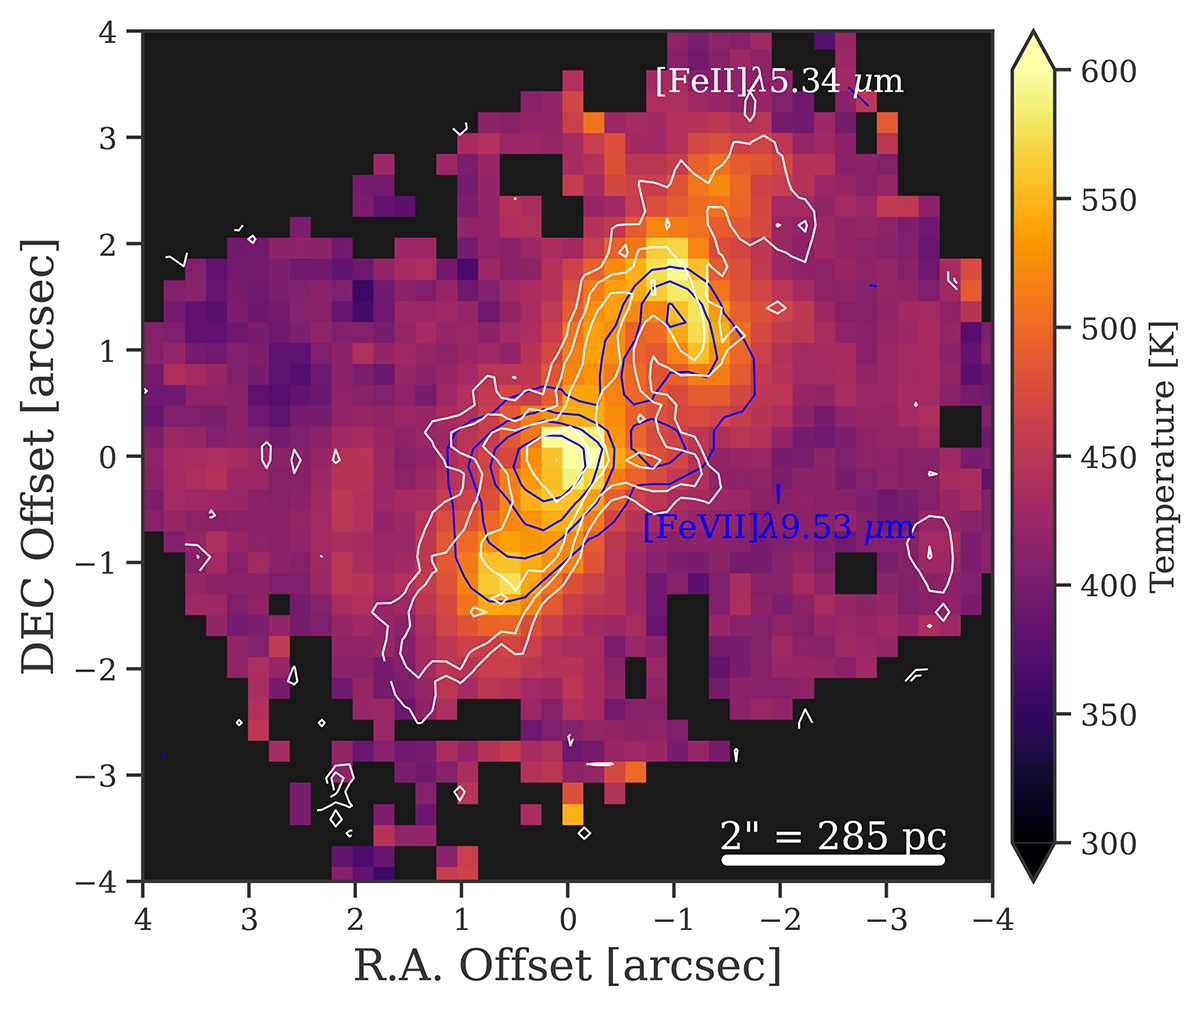
Fig. 9.
Download original image
H2 excitation map. Map of molecular gas temperature derived from the S(1)/S(5) line ratio (shown at the 0.20″ pixel scale of the S(1) line). This characteristic temperature also represents the distribution of temperatures at each location. The comparison to the [Fe II] and [Fe VII] lines (white and blue contours respectively) show that the warmer H2 emission traces the edge rather than bulk of the ionisation cone. Specifically, it traces the northern edge of the western cone and the southern edge of the eastern cone.
Current usage metrics show cumulative count of Article Views (full-text article views including HTML views, PDF and ePub downloads, according to the available data) and Abstracts Views on Vision4Press platform.
Data correspond to usage on the plateform after 2015. The current usage metrics is available 48-96 hours after online publication and is updated daily on week days.
Initial download of the metrics may take a while.