Open Access
Fig. 7.
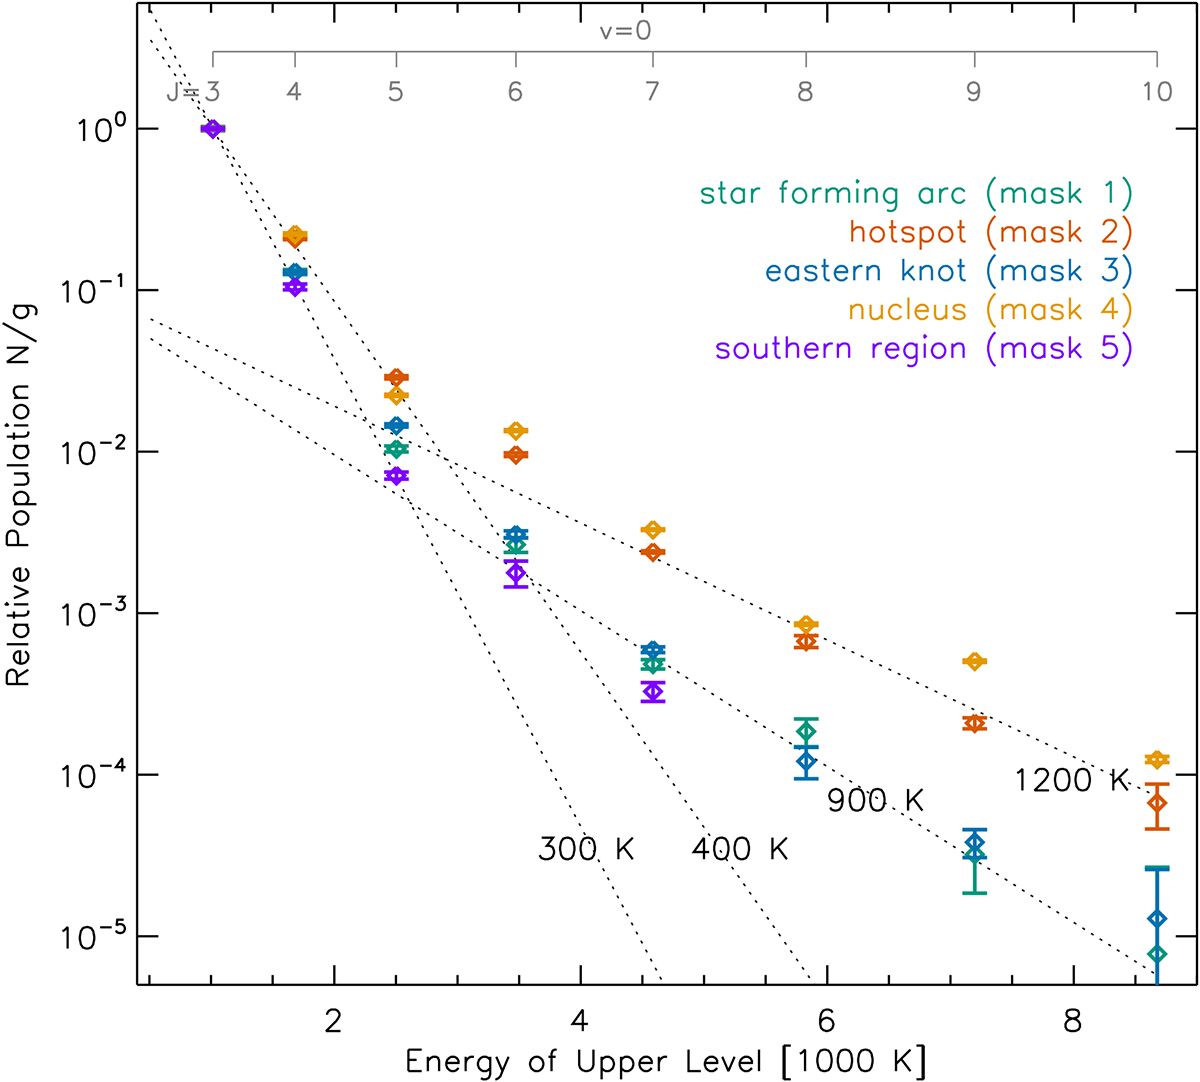
Download original image
Population levels for several apertures. The level populations derived from the extracted fluxes show that these fall into two groups. The dashed lines for single temperatures of 300 K, 400 K, 900 K and 1200 K characterise the temperature range probed by the lines.
Current usage metrics show cumulative count of Article Views (full-text article views including HTML views, PDF and ePub downloads, according to the available data) and Abstracts Views on Vision4Press platform.
Data correspond to usage on the plateform after 2015. The current usage metrics is available 48-96 hours after online publication and is updated daily on week days.
Initial download of the metrics may take a while.