Fig. 6.
Download original image
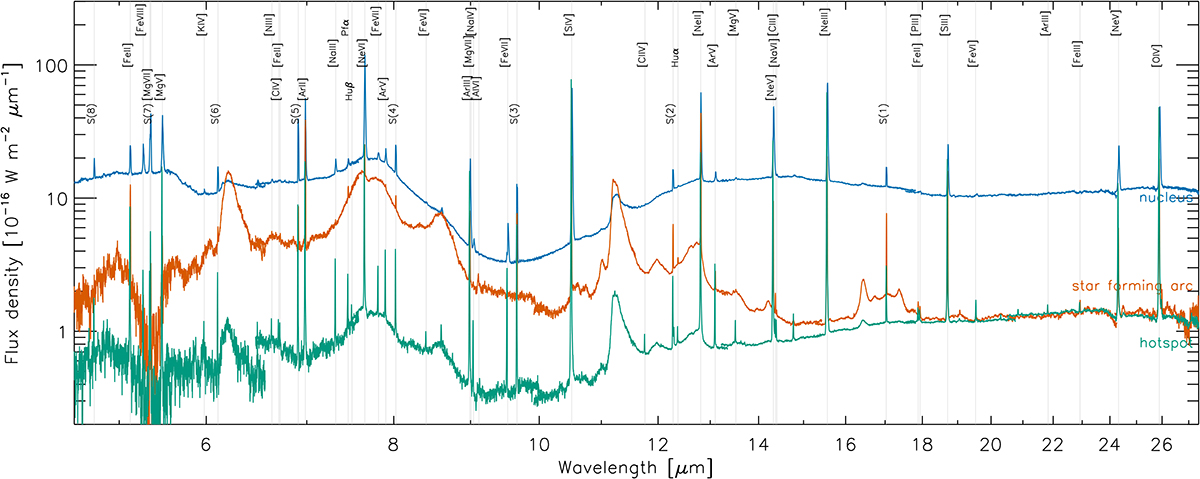
Mid-infrared spectra in NGC 5728. The spectra for three apertures, corresponding to the nucleus (blue; region 4 in Fig. 5), star forming arc (red; region 1 in Fig. 5), and hotspot (green; region 2 in Fig. 5) are shown on a logarithmic flux scale. The spectra have been extracted from each of the 12 separate datacubes and overplotted. They show that no re-scaling between the cubes is needed. The most prominent lines with reliable identifications have been marked: 36 fine structure lines, 3 H I lines, and 8 H2 lines.
Current usage metrics show cumulative count of Article Views (full-text article views including HTML views, PDF and ePub downloads, according to the available data) and Abstracts Views on Vision4Press platform.
Data correspond to usage on the plateform after 2015. The current usage metrics is available 48-96 hours after online publication and is updated daily on week days.
Initial download of the metrics may take a while.