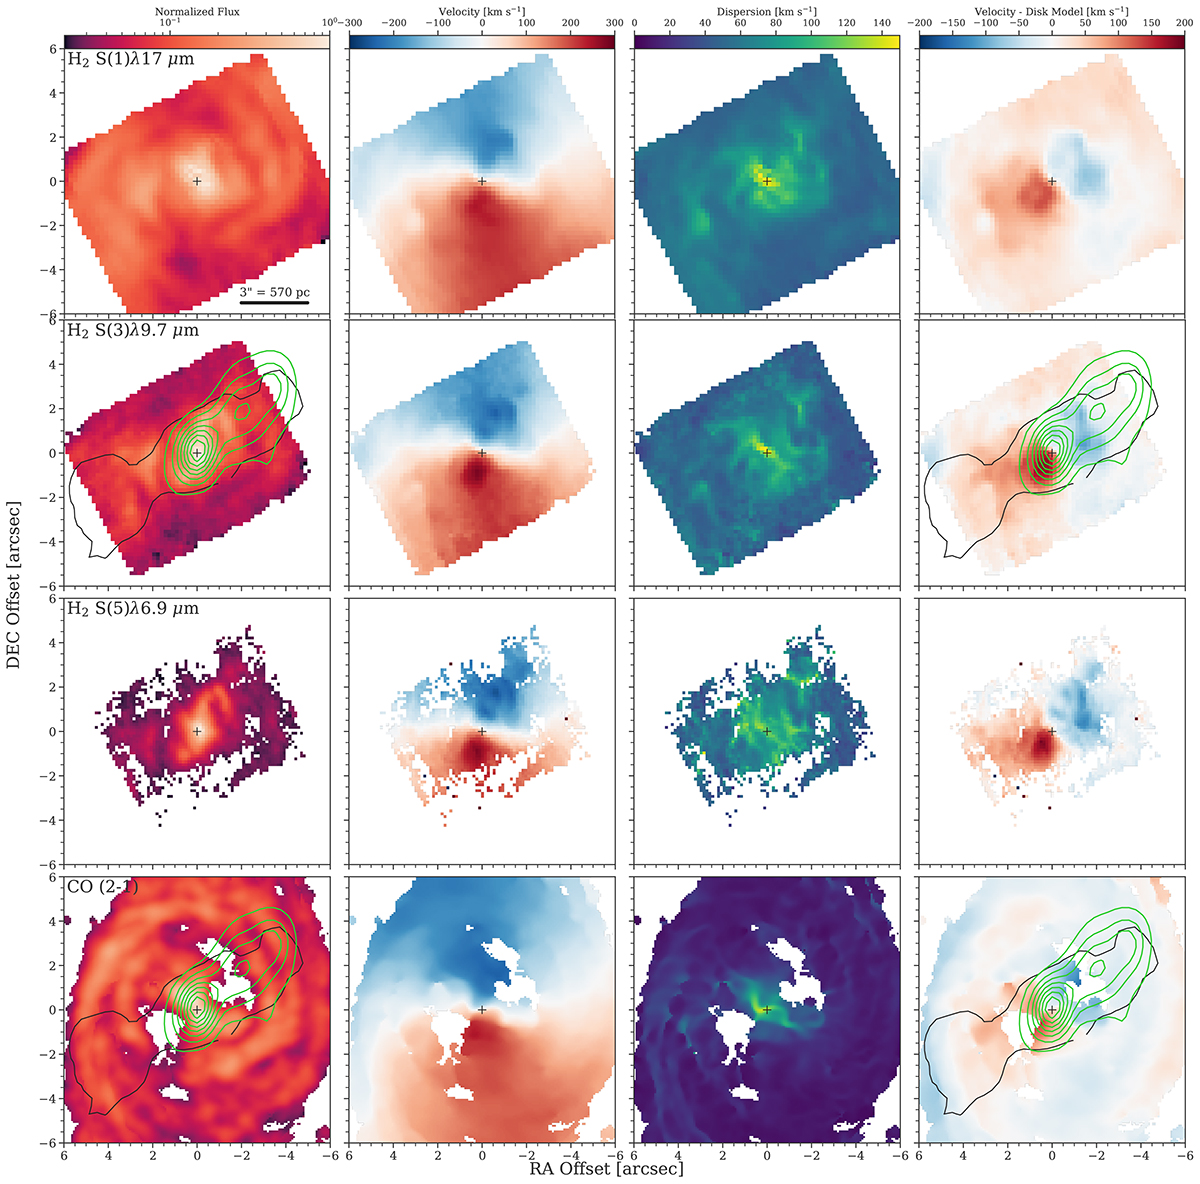
Fig. 4.
Download original image
Flux and kinematics maps of molecular lines. The flux (far left), velocity (centre left), velocity dispersion (centre right), and residual velocity after subtracting a disk model (far right) are shown for the H2 0-0 S(1), 0-0 S(3), and 0-0 S(5) and 1.3 mm CO (2-1) lines. The CO data and disk model are from Shimizu et al. (2019). In all cases north is up, east is left. These data are the focus of the analysis in Sect. 5 and Sect. 6. The most striking features are: (i) the morphology and kinematics of the CO and S(1) lines are remarkably similar indicating they trace the same gas component, (ii) while CO is not detected in the ionisation cones, the rotational H2 lines are detected with a perturbed velocity field, and (iii) the largest velocity residuals are well-aligned with the ionisation cone as traced by the [Ne V] emission (black contour) and the radio jet at 20 cm (green contours).
Current usage metrics show cumulative count of Article Views (full-text article views including HTML views, PDF and ePub downloads, according to the available data) and Abstracts Views on Vision4Press platform.
Data correspond to usage on the plateform after 2015. The current usage metrics is available 48-96 hours after online publication and is updated daily on week days.
Initial download of the metrics may take a while.