Fig. 2.
Download original image
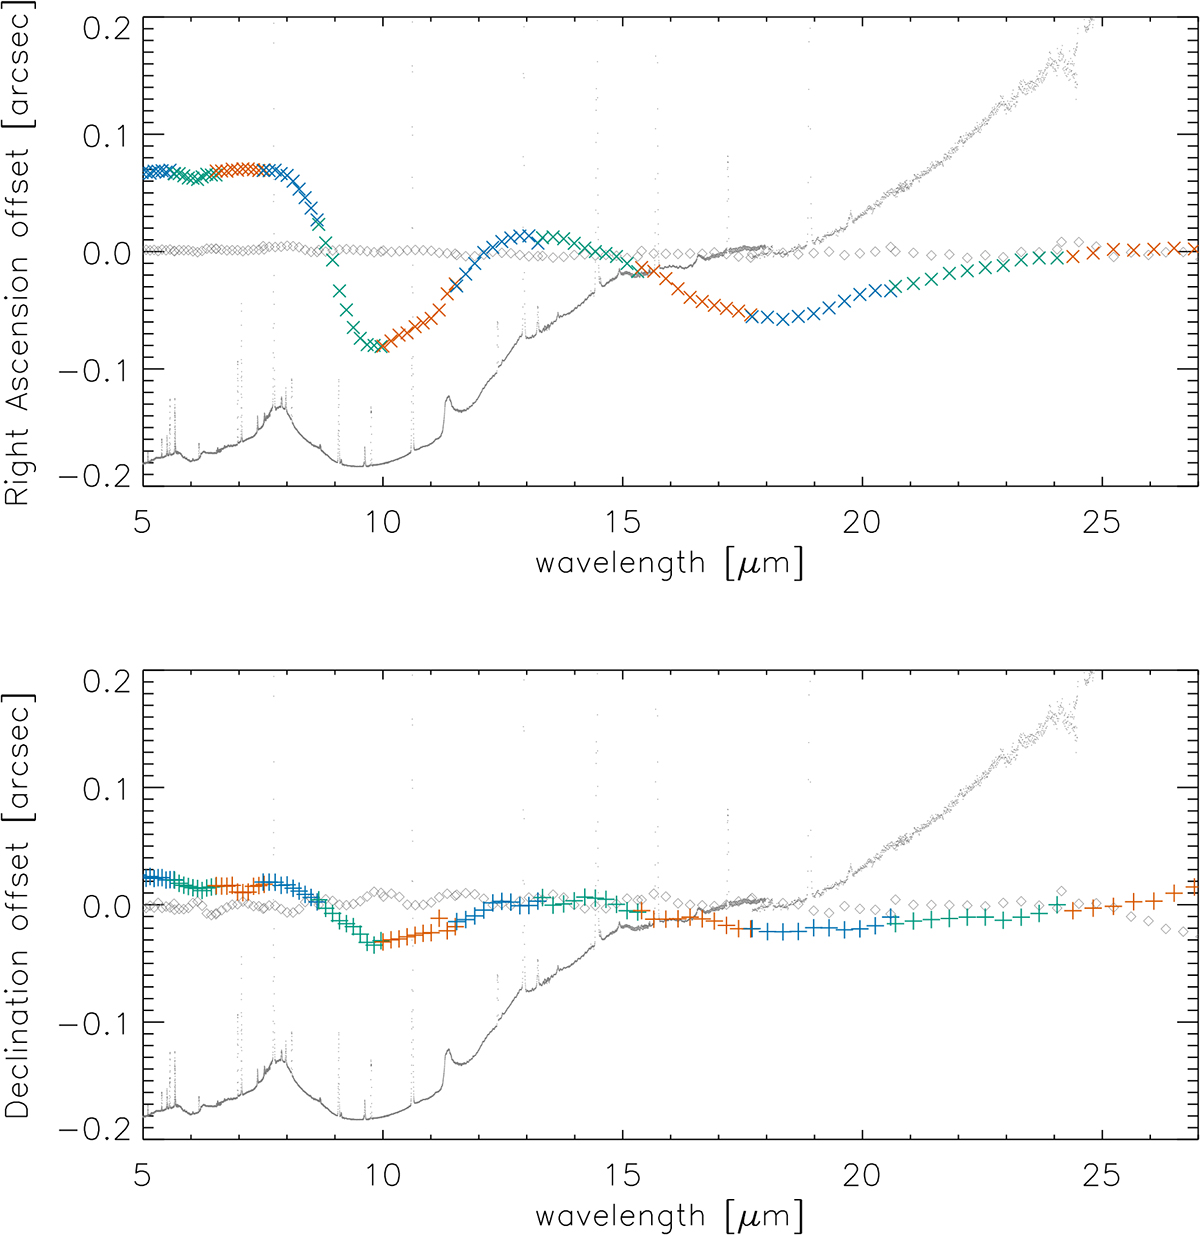
Spectro-astrometry of NGC 5728. The relative position of the continuum peaks are shown for right ascension (top) and declination (bottom). The colours demarcate the spectral channels, showing that the datacubes are well aligned spatially and that there is a wavelength dependent shift of the position. For reference, the equivalent measurement for MCG-05-16-023, dominated by a continuum point source and, as is more typical of the sample, showing no spectro-astrometric shifts is also shown as open diamonds (see Esparza-Arredondo et al. in prep.); and the nuclear spectrum is overplotted.
Current usage metrics show cumulative count of Article Views (full-text article views including HTML views, PDF and ePub downloads, according to the available data) and Abstracts Views on Vision4Press platform.
Data correspond to usage on the plateform after 2015. The current usage metrics is available 48-96 hours after online publication and is updated daily on week days.
Initial download of the metrics may take a while.