Fig. 13.
Download original image
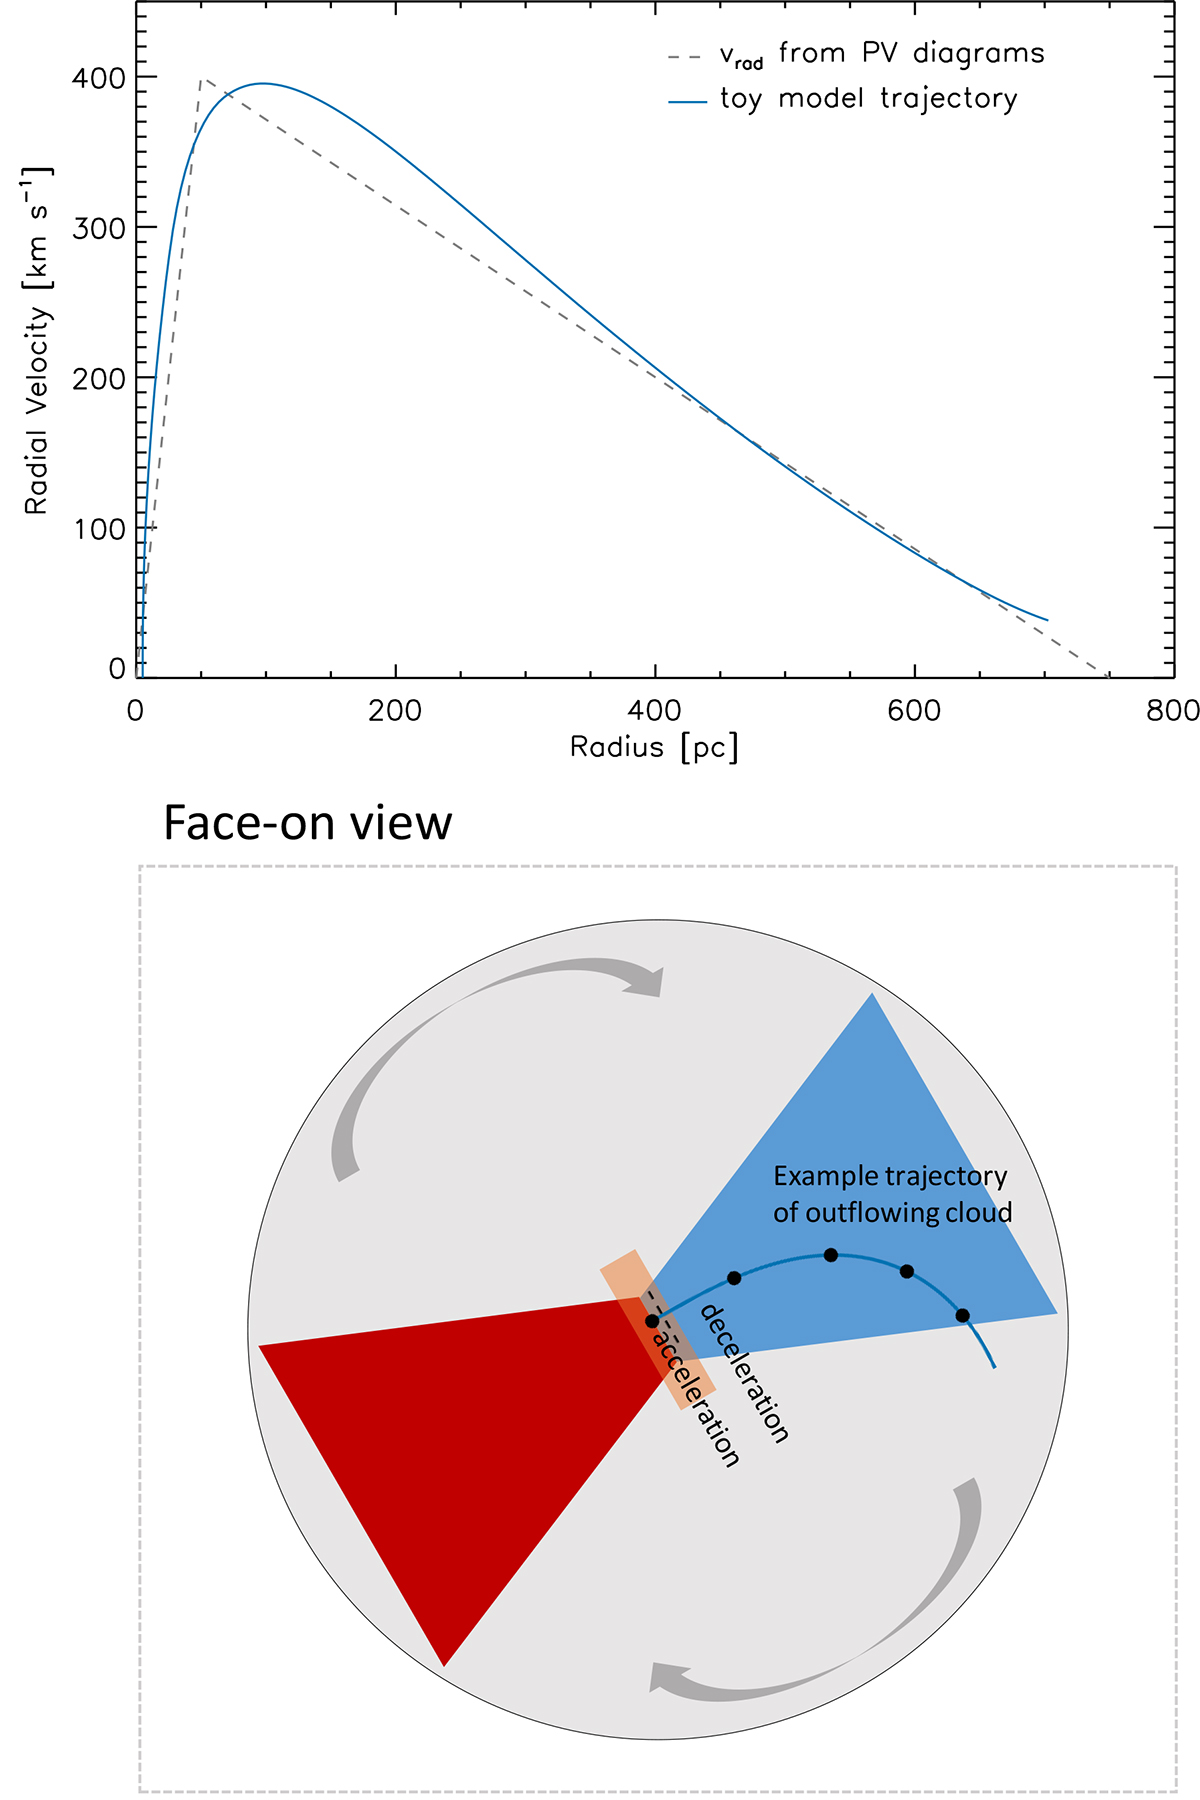
Toy model of the outflow deceleration. Top panel: radial velocity of the H2 as a function of distance from the centre along the ionisation cone. The dashed grey line represents the simple description given in Eq. (1) and Fig. 12. The solid blue line is a toy model described in Sect. 6.2, illustrating that this trajectory can be qualitatively assigned to a combination of the increasing gravitational potential and mass-loading. Bottom panel: characteristic spatial trajectory of a cloud described by the toy model, where the black circles indicate 0.5 Myr intervals. Initially the motion is radially outwards, but as the cloud decelerates the momentum imparted by mass-loading diverts it to tangential motion.
Current usage metrics show cumulative count of Article Views (full-text article views including HTML views, PDF and ePub downloads, according to the available data) and Abstracts Views on Vision4Press platform.
Data correspond to usage on the plateform after 2015. The current usage metrics is available 48-96 hours after online publication and is updated daily on week days.
Initial download of the metrics may take a while.