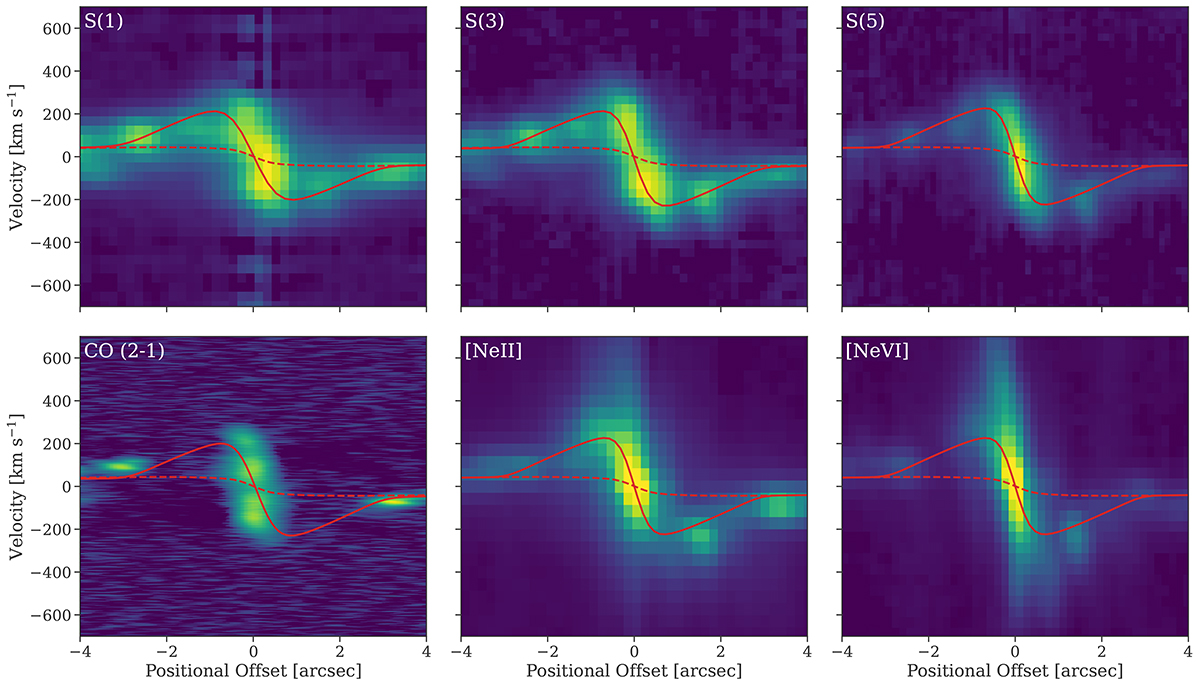
Fig. 12.
Download original image
Position-velocity diagrams along the outflow. A pseudo-slit width of 1″at a position angle of −60 deg East of North was used to extract PV diagrams for the H2 0-0 S(1), S(3), S(5), CO (2-1), [Ne II], and [Ne VI] emission lines. In each case the continuum has been subtracted (although a residual from wiggles in the continuum can be seen in the panel for the S(1) line). Overplotted are the best fit rotating disk model from (Shimizu et al. 2019, dashed red line) and the best fit rotating disk with a planar radial outflow described in Sect. 6.1 for the S(5) line (solid red line). At large radii, all lines trace only the pure rotation while the inner regions need an outflow component. The molecular gas kinematics can be modelled well with a planar radial outflow while the ionised gas clearly has a separate high velocity, compact outflow being lifted off the disk. As comparison numbers for the CO line, outside the central 1–2″ the circular velocity is around 300 km s−1 while the dispersion is typically 15 km s−1.
Current usage metrics show cumulative count of Article Views (full-text article views including HTML views, PDF and ePub downloads, according to the available data) and Abstracts Views on Vision4Press platform.
Data correspond to usage on the plateform after 2015. The current usage metrics is available 48-96 hours after online publication and is updated daily on week days.
Initial download of the metrics may take a while.