Open Access
Fig. 9.
Download original image
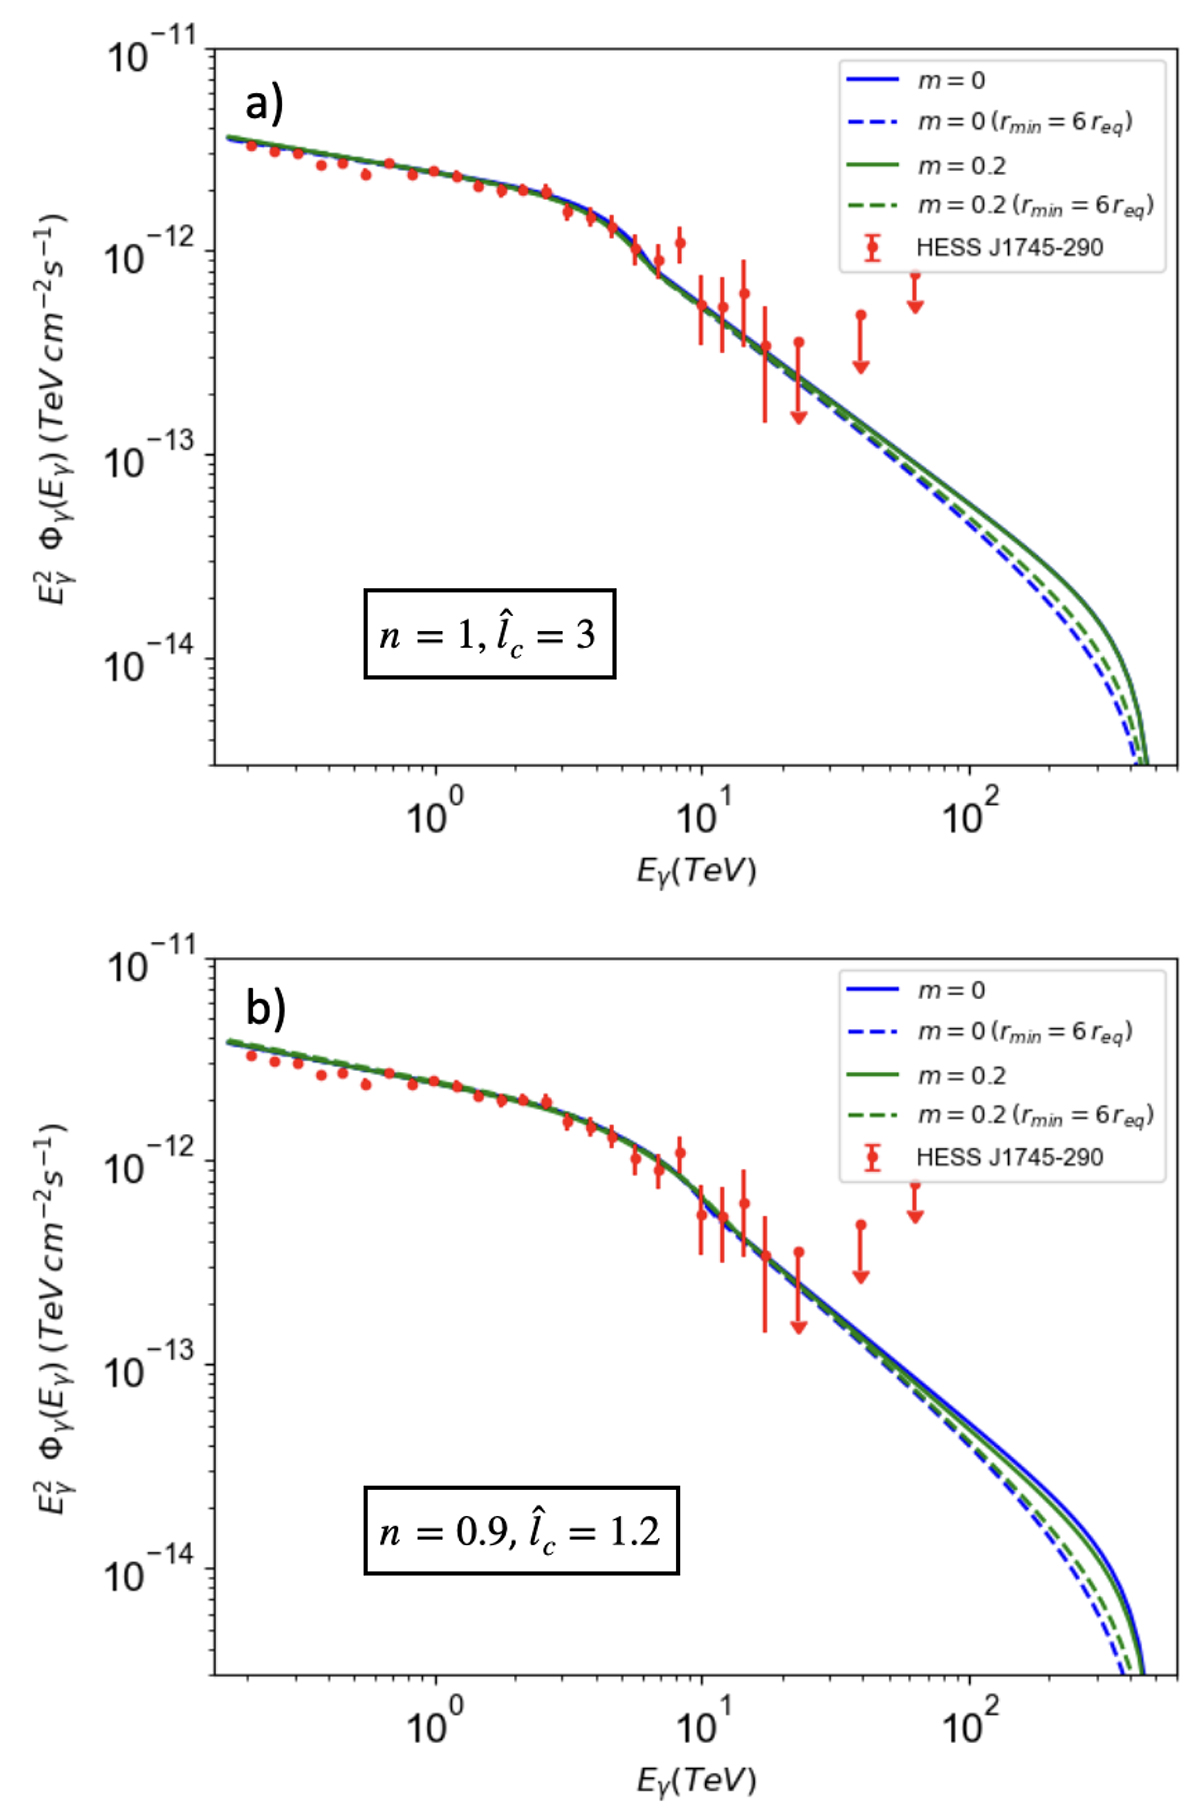
Effect of using different minimum radii rmin on the gamma-ray spectra. The solid and dashed lines represent analogous cases using rmin = 10 Rg and rmin = 6 req, respectively. Panels a and b show the cases where n = 1, ![]() and n = 0.9,
and n = 0.9, ![]() , respectively. In both panels we consider m = 0 (blue lines) and m = 0.2 (green lines).
, respectively. In both panels we consider m = 0 (blue lines) and m = 0.2 (green lines).
Current usage metrics show cumulative count of Article Views (full-text article views including HTML views, PDF and ePub downloads, according to the available data) and Abstracts Views on Vision4Press platform.
Data correspond to usage on the plateform after 2015. The current usage metrics is available 48-96 hours after online publication and is updated daily on week days.
Initial download of the metrics may take a while.