Fig. 3.
Download original image
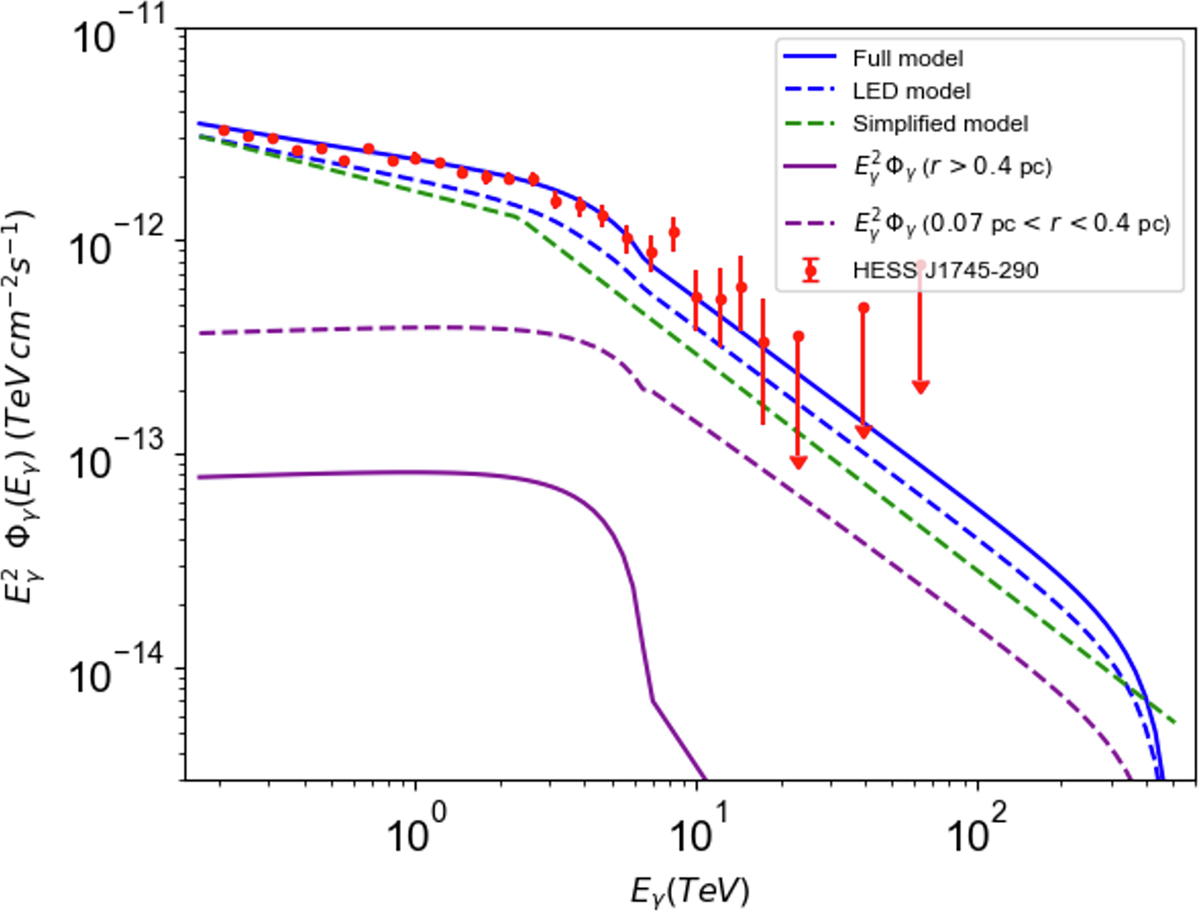
Full and approximate models for the gamma-ray spectrum of HESS J1745−290 with the parameters of Case 2 of Table 1. The solid blue line represents the total gamma-ray emission calculated from the full model. The dashed blue line is the “LED model”, considering only the emission from CRs in the LED regime. The dashed green line shows our simplified model, given by Eqs. (30) and (31). The solid and dashed purple lines represent the contributions from CRs at r > 0.4 pc and 0.07 pc < r < 0.4 pc, respectively. The red dots correspond to the H.E.S.S. measurements (HESS Collaboration 2016).
Current usage metrics show cumulative count of Article Views (full-text article views including HTML views, PDF and ePub downloads, according to the available data) and Abstracts Views on Vision4Press platform.
Data correspond to usage on the plateform after 2015. The current usage metrics is available 48-96 hours after online publication and is updated daily on week days.
Initial download of the metrics may take a while.