Fig. 8
Download original image
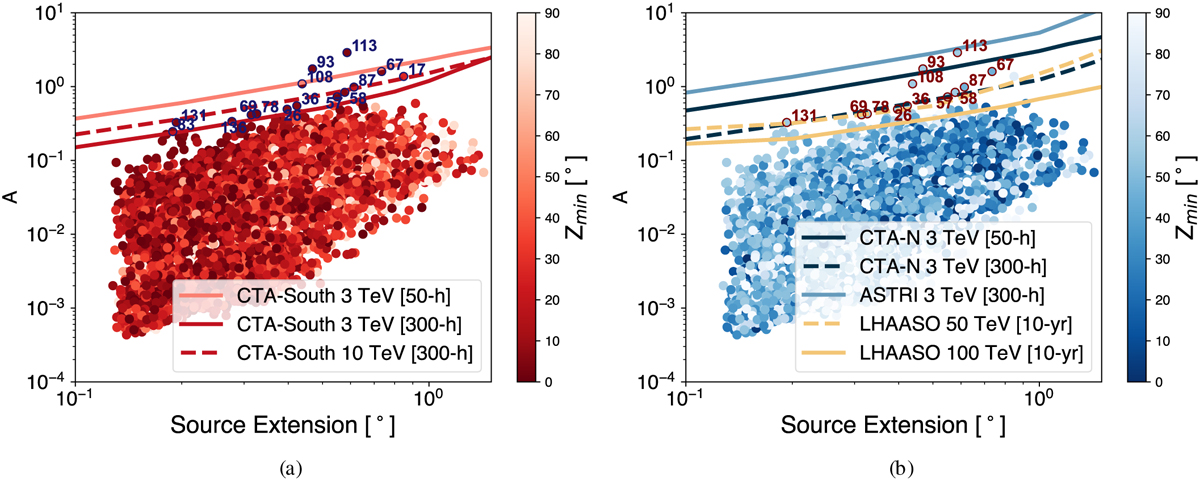
Detectability of MCs from the Miville-Deschênes et al. (2017) catalogue (circles), in terms of their computed A parameter and extension. The sensitivity of various instruments at different energies are normalised to the expected cloud emissivity at the same energy (see text). The left panel refers to CTA-S, while the right panel to northern observatories. The same cloud sample is reported in the two panels, while the colour scale refers to the minimum zenith angle of the clouds at each location. Clouds with expected gamma-ray fluxes above the sensitivity requirements and culminating at a zenith angle smaller than 60° are further labelled in the figure with their identifier, as defined in the Miville-Deschênes et al. (2017) catalogue.
Current usage metrics show cumulative count of Article Views (full-text article views including HTML views, PDF and ePub downloads, according to the available data) and Abstracts Views on Vision4Press platform.
Data correspond to usage on the plateform after 2015. The current usage metrics is available 48-96 hours after online publication and is updated daily on week days.
Initial download of the metrics may take a while.