Fig. 5
Download original image
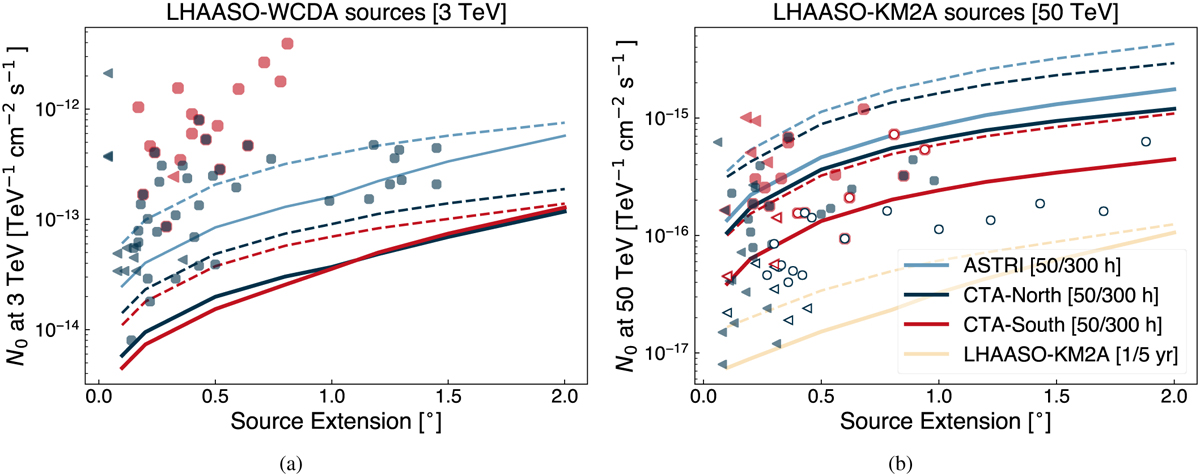
Differential flux of LHAASO first catalogue sources as a function of their radius, measured (circles) or upper limits (triangles), as evaluated by (a) WCDA at 3 TeV and (b) KM2A at 50 TeV. The colour code refers to culmination at zenith angles below 30° at each observatory sites (red for CTA-South, blue for CTA-North and ASTRI). Filled markers in the right panel correspond to UHE sources in LHAASO first source catalogue (with test statistics at 100 TeV TS100 > 20). Lines show the ASTRI and CTA differential sensitivities as a function of the source extension; dashed for shorter observation time and solid for the longer one, as indicated in the legend that applies to both panels.
Current usage metrics show cumulative count of Article Views (full-text article views including HTML views, PDF and ePub downloads, according to the available data) and Abstracts Views on Vision4Press platform.
Data correspond to usage on the plateform after 2015. The current usage metrics is available 48-96 hours after online publication and is updated daily on week days.
Initial download of the metrics may take a while.