Fig. A.2
Download original image
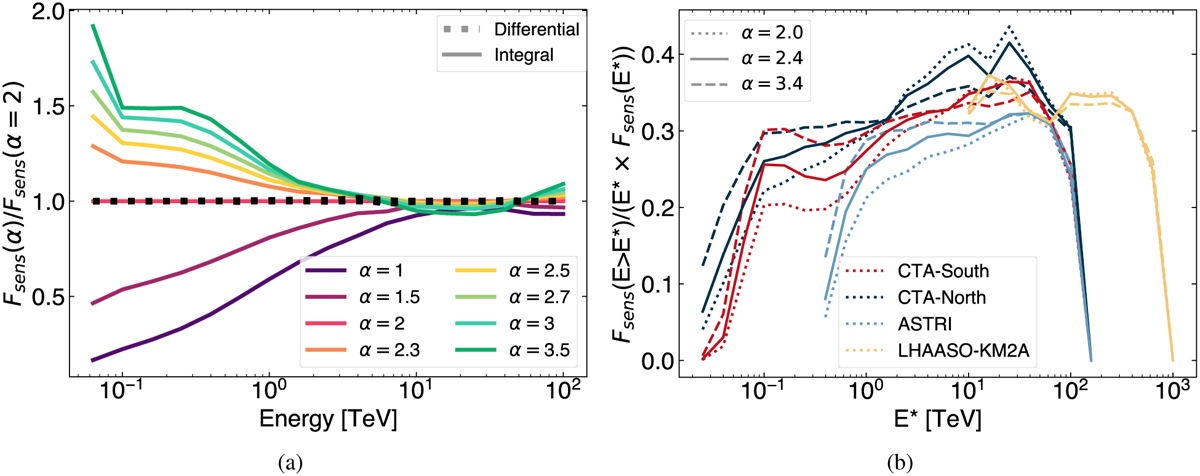
Left: Ratio between CTA-S integral (solid) or differential (dotted) sensitivities computed for different spectral slopes α (given in the legend) of a point-like source, and the corresponding one evaluated for α = 2.0. All the curves for differential sensitivities overlap, as expected. Right: Ratio between point-like integral sensitivity (calculated for the spectral slopes indicated in the legend) and point-like differential sensitivity (multiplied by energy E*) at various energy bins centred in E*, for ASTRI, CTA and LHAASO-KM2A.
Current usage metrics show cumulative count of Article Views (full-text article views including HTML views, PDF and ePub downloads, according to the available data) and Abstracts Views on Vision4Press platform.
Data correspond to usage on the plateform after 2015. The current usage metrics is available 48-96 hours after online publication and is updated daily on week days.
Initial download of the metrics may take a while.