Fig. 10
Download original image
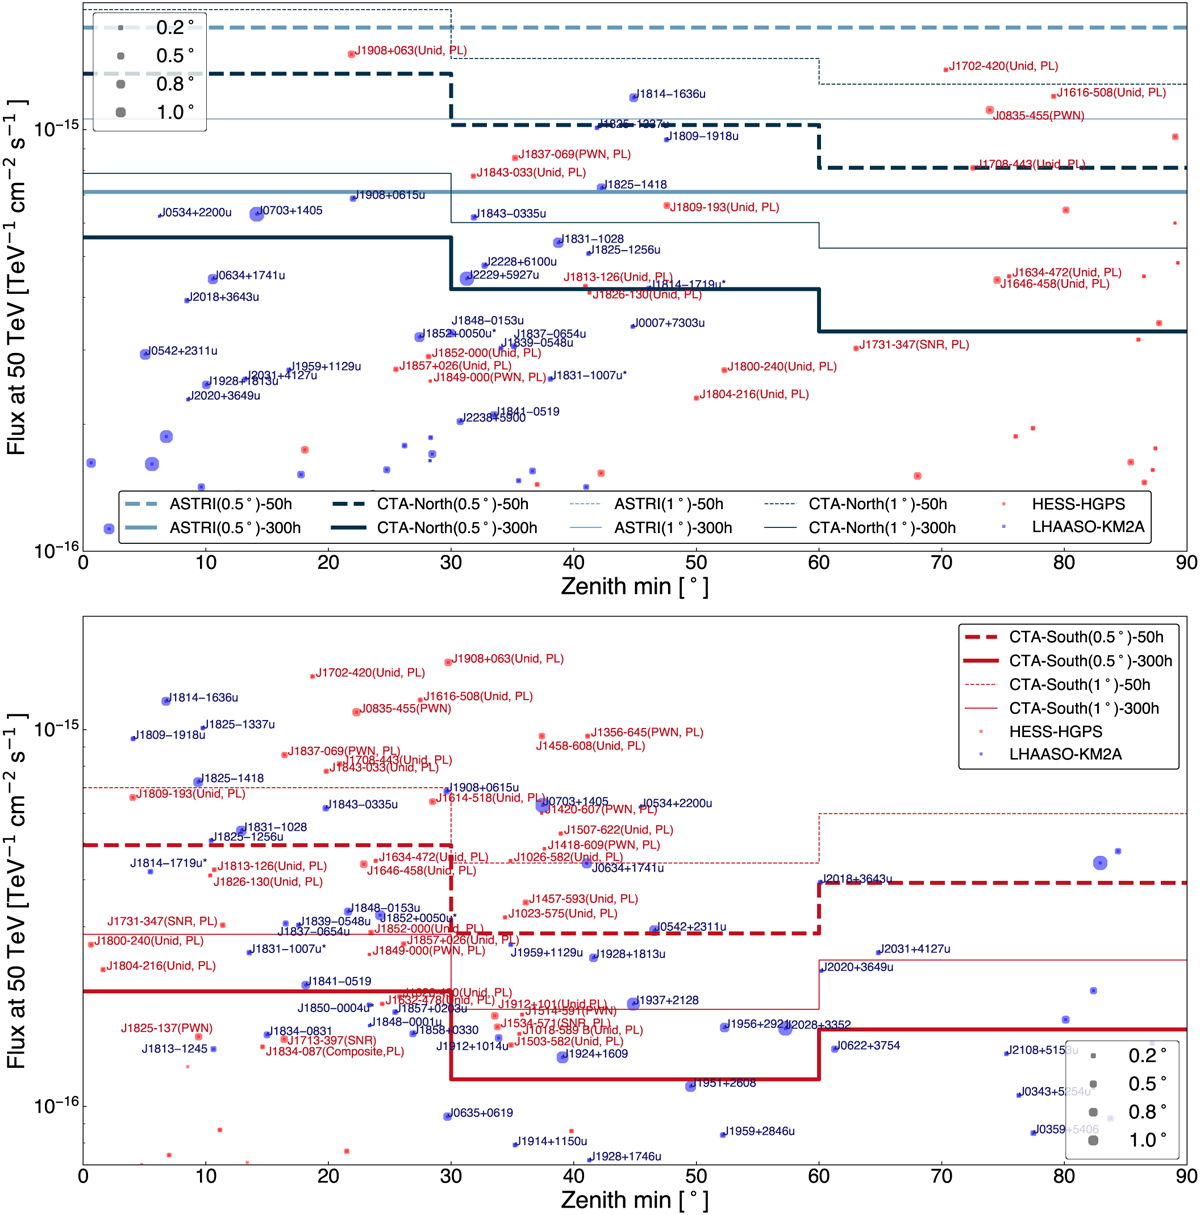
Differential gamma-ray flux at 50 TeV, either measured from LHAASO-KM2A source sample (blue dots) or extrapolated from the H.G.P.S. catalogue (red dots), as discussed in the text, as a function of the minimum zenith of observation from the northern sites (left panel) and the southern sites (right panel). Differential sensitivity lines of IACTs are also shown for comparison at different exposures and for extended source observations, as indicated in the legend.
Current usage metrics show cumulative count of Article Views (full-text article views including HTML views, PDF and ePub downloads, according to the available data) and Abstracts Views on Vision4Press platform.
Data correspond to usage on the plateform after 2015. The current usage metrics is available 48-96 hours after online publication and is updated daily on week days.
Initial download of the metrics may take a while.