Fig. 1
Download original image
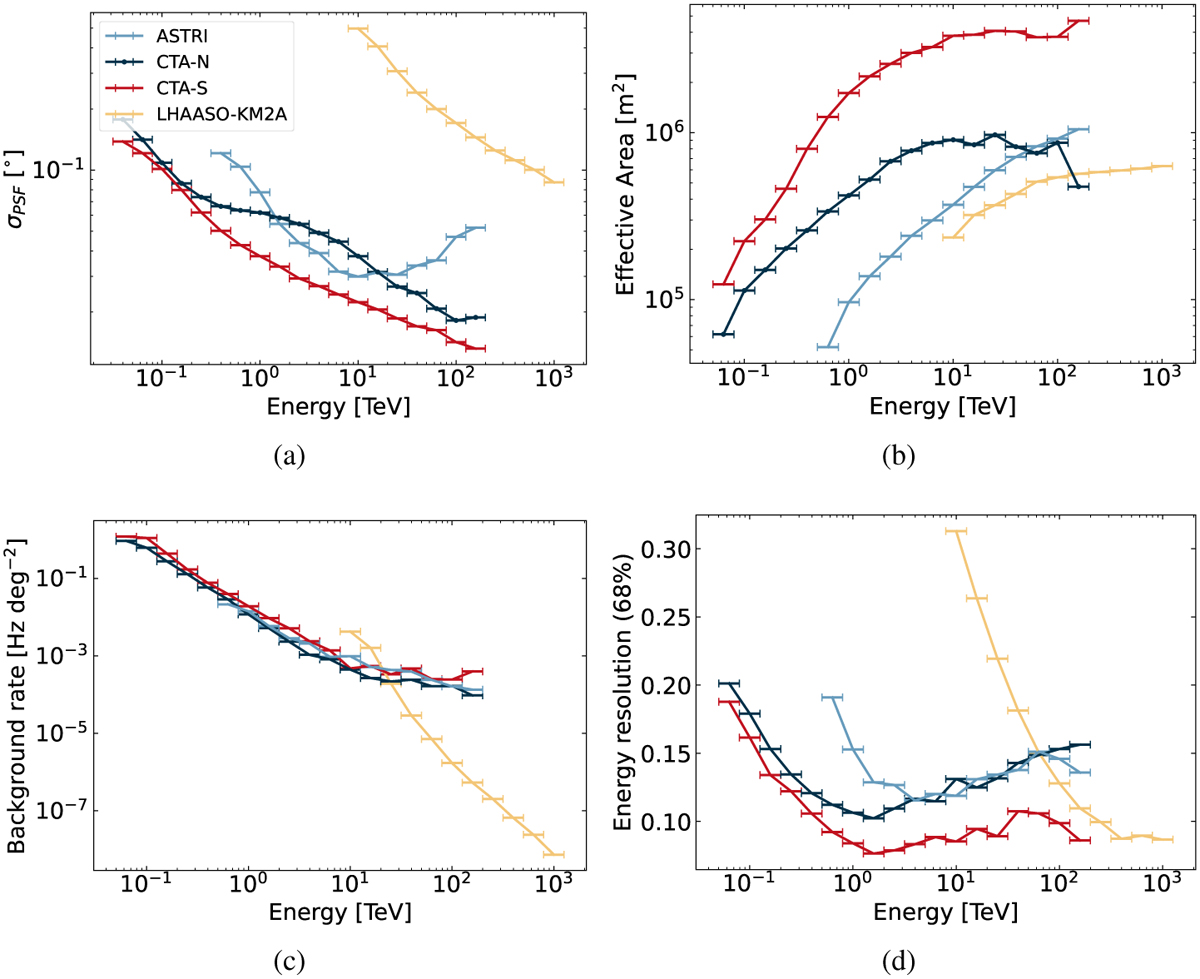
Comparison between IRFs of LHAASO-KM2A (Cao et al. 2024b) and the on-axis ones of CTA (north and south) (Cherenkov Telescope Array Observatory & Cherenkov Telescope Array Consortium 2021) and ASTRI (ASTRI-Project 2022), as indicated in the legend, which applies to all panels. (a) 1-σ width of the PSF approximated as a Gaussian distribution. (b) effective area, (c) background rate, and (d) energy resolution. The drop observable in the last point of the CTA-N effective area is an artefact of the simulations, resulting from a statistical fluctuation.
Current usage metrics show cumulative count of Article Views (full-text article views including HTML views, PDF and ePub downloads, according to the available data) and Abstracts Views on Vision4Press platform.
Data correspond to usage on the plateform after 2015. The current usage metrics is available 48-96 hours after online publication and is updated daily on week days.
Initial download of the metrics may take a while.