Fig. 3
Download original image
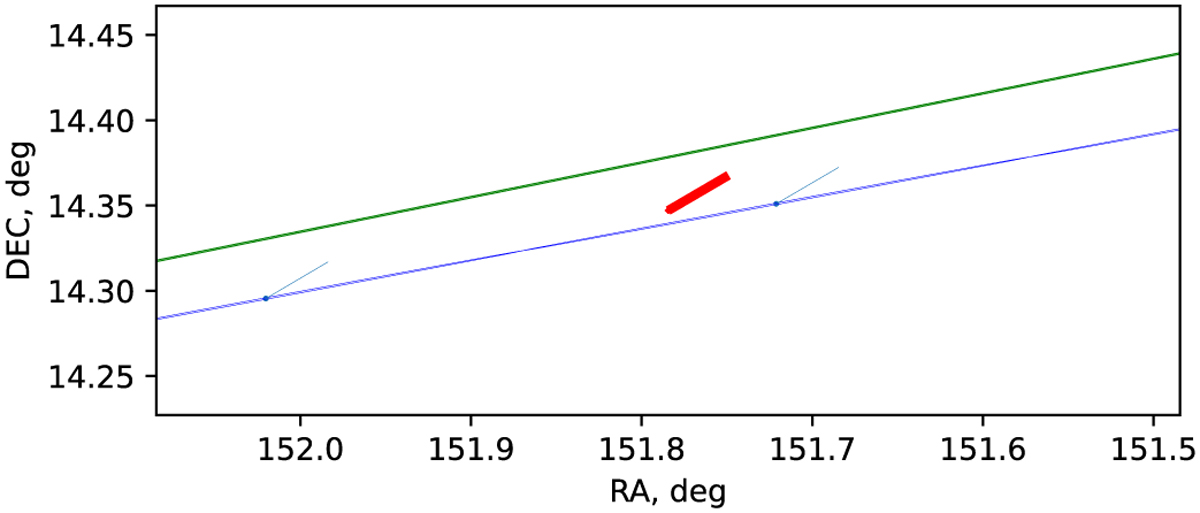
Zoom onto the observation shown in Fig. 2. The red line is the observation found by Perlbarg et al. (2023). The observation has the appearance of a line, because the photographic plate has an exposure time of 50 min. The blue dots and thin blue ellipsoids around them predict the beginning of the actual observation. The green thin part of the ellipsoid is as before the uncertainty region of the nominal position constructed from only the covariance matrix. The light-blue lines starting from the blue dots predict the direction and the length of the actual observation.
Current usage metrics show cumulative count of Article Views (full-text article views including HTML views, PDF and ePub downloads, according to the available data) and Abstracts Views on Vision4Press platform.
Data correspond to usage on the plateform after 2015. The current usage metrics is available 48-96 hours after online publication and is updated daily on week days.
Initial download of the metrics may take a while.