Fig. A.1
Download original image
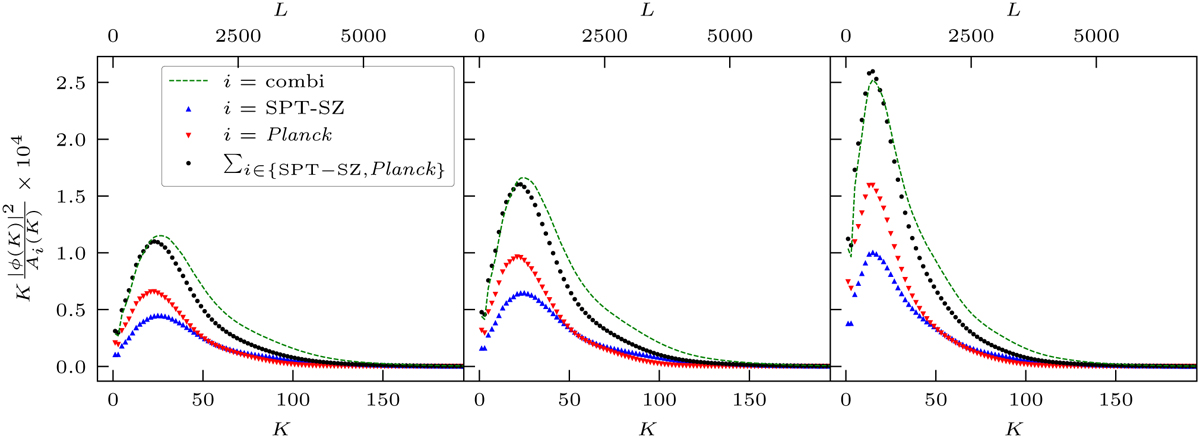
Contribution of each Fourier mode K to the lensing estimator S/N. Four curves are drawn: SPT-SZ (blue triangles), Planck (red downward triangles), the sum of the two first curves (black dots) and the combination of both datasets (dashed green line). The three panels cover the range of ϕ(K) that are used, corresponding to the smallest (left), median (middle) and largest (right) cluster of our sample in term of angular diameter size.
Current usage metrics show cumulative count of Article Views (full-text article views including HTML views, PDF and ePub downloads, according to the available data) and Abstracts Views on Vision4Press platform.
Data correspond to usage on the plateform after 2015. The current usage metrics is available 48-96 hours after online publication and is updated daily on week days.
Initial download of the metrics may take a while.