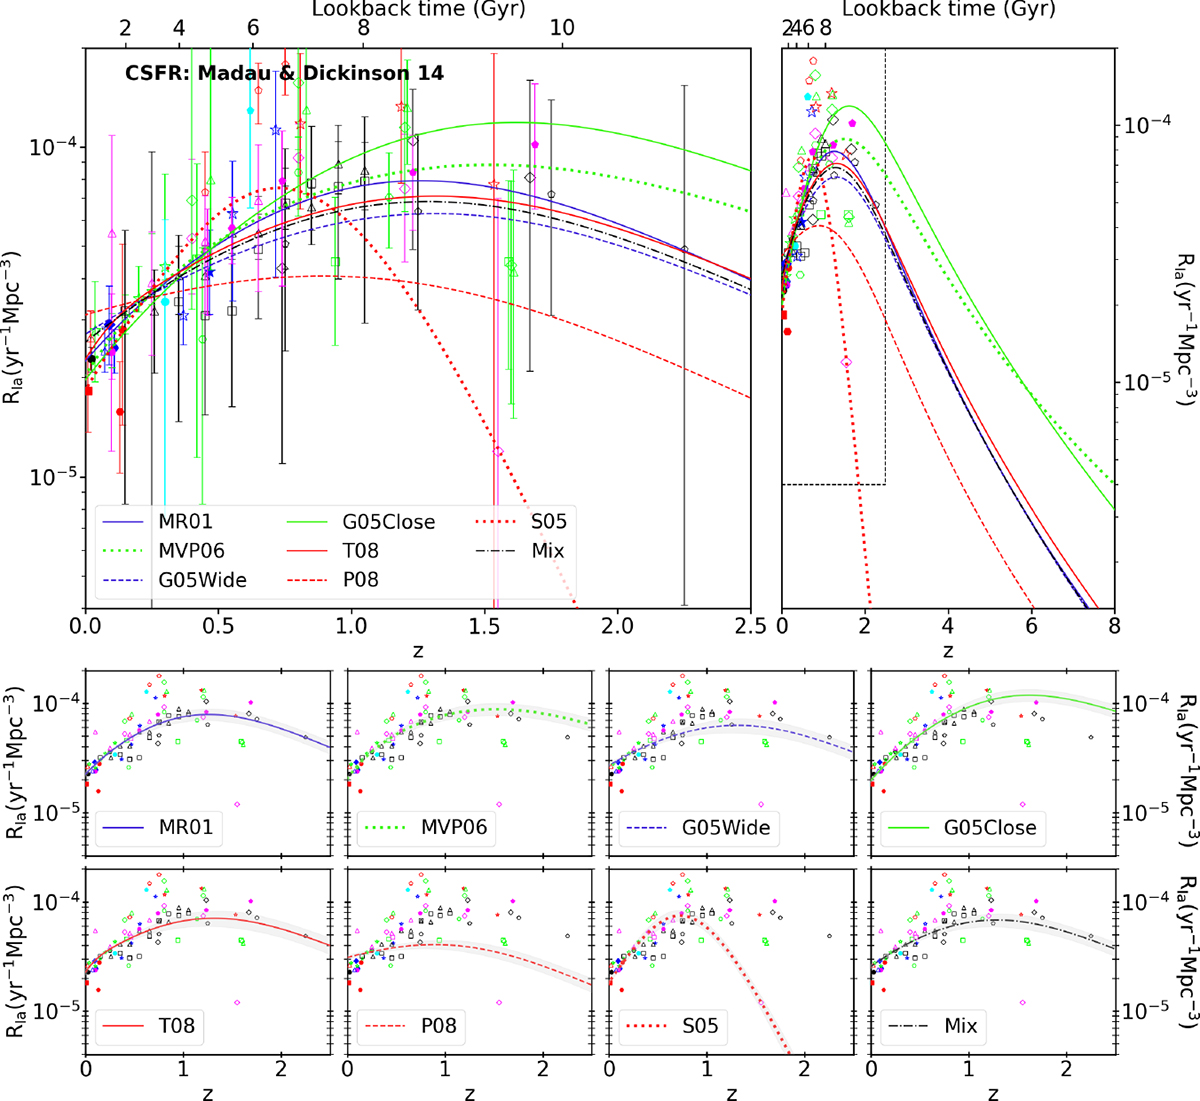
Fig. C.1.
Download original image
Type Ia SN rate RIa as function of redshift z (lower horizontal axis) and age (upper horizontal axis) assuming the CSFR of Madau & Dickinson (2014). Each marker-color pair corresponds to one reference in the literature: Li et al. 2011b (open red triangles); Neill et al. 2006 (filled blue stars); Barris & Tonry 2006 (open red pentagons); Graur & Maoz 2013 (filled blue hexagons); Madgwick et al. 2003 (filled magenta circles); Poznanski et al. 2007 (open black diamonds); Cappellaro et al. 1999 (filled red squares); Frohmaier et al. 2019 (open blue triangles); Barbary et al. 2012 (open red stars); Melinder et al. 2012 (filled cyan pentagons); Blanc et al. 2004 (filled red hexagons); Hardin et al. 2000 (filled red circles); Kuznetsova et al. 2008 (open magenta diamonds); Graur et al. 2014 (open lime squares); Perrett et al. 2012 (open black triangles); Dilday et al. 2010 (open lime stars); Rodney et al. 2014 (open black pentagons); Okumura et al. 2014 (open lime hexagons); Botticella et al. 2008 (filled cyan circles); Dahlen et al. 2004 (open lime diamonds); Rodney & Tonry 2010 (open black squares); Cappellaro et al. 2015 (open magenta triangles); Neill et al. 2007 (open blue stars); Graur et al. 2011 (filled magenta pentagons); Pain et al. 2002 (filled magenta hexagons); Dilday et al. 2008 (filled blue diamonds); Tonry et al. 2003 (open magenta squares); Dahlen et al. 2008 (open lime triangles); Desai et al. 2024 (solid black circle). The curves represent the best fits for the assumed DTDs (labeled in the legend). Upper right panel gives a zoomed-out version of the upper left one (enclosed by the dashed lines) without showing the error bars for the sake of visualization. Bottom panels illustrate the confidence intervals (±1σ) of the Type Ia SN rate computed from the errors in CSFR, assuming the DTDs indicated in each legend.
Current usage metrics show cumulative count of Article Views (full-text article views including HTML views, PDF and ePub downloads, according to the available data) and Abstracts Views on Vision4Press platform.
Data correspond to usage on the plateform after 2015. The current usage metrics is available 48-96 hours after online publication and is updated daily on week days.
Initial download of the metrics may take a while.