Fig. 3.
Download original image
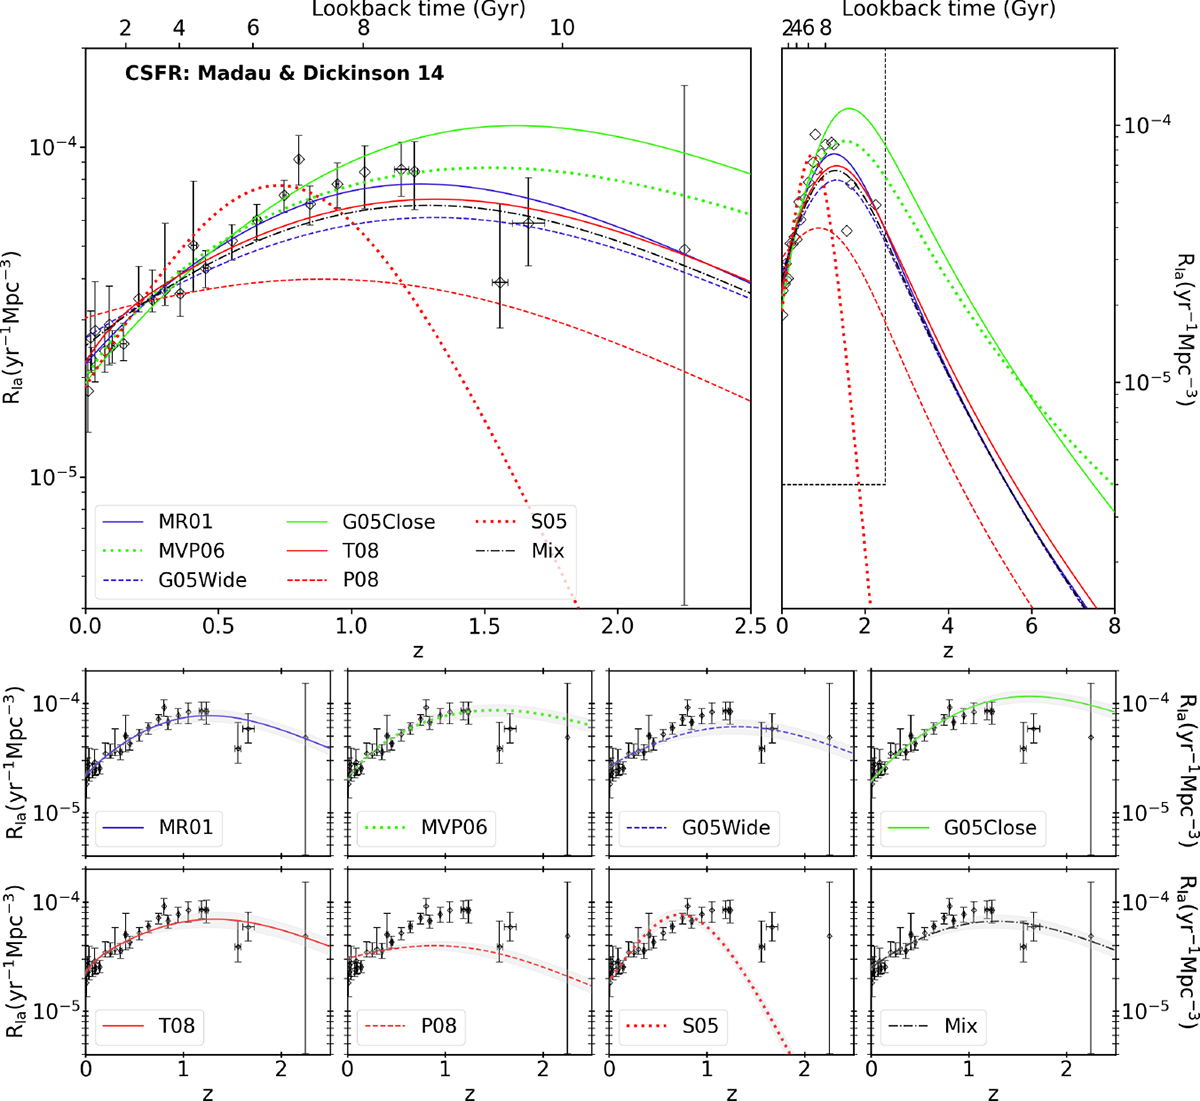
Type Ia SN rate RIa as a function of redshift z (lower horizontal axis) and age (upper horizontal axis) assuming the CSFR of Madau & Dickinson (2014). Black markers represent the binned observational data compiled from the literature and reported in Table 1. The curves correspond to the best fits assuming the DTDs used in Palicio et al. (2023), while the black dashed-dotted line denotes a combination of the MR01 and G05Wide DTDs (see Sect. 5.2), both labeled in the legend. Upper right panel shows a zoomed-out view of the upper left one, enclosed by the dashed black lines. Bottom panels illustrate the confidence intervals (±1σ) of the Type Ia SN rate computed from the errors in CSFR, assuming the DTDs indicated in each legend.
Current usage metrics show cumulative count of Article Views (full-text article views including HTML views, PDF and ePub downloads, according to the available data) and Abstracts Views on Vision4Press platform.
Data correspond to usage on the plateform after 2015. The current usage metrics is available 48-96 hours after online publication and is updated daily on week days.
Initial download of the metrics may take a while.