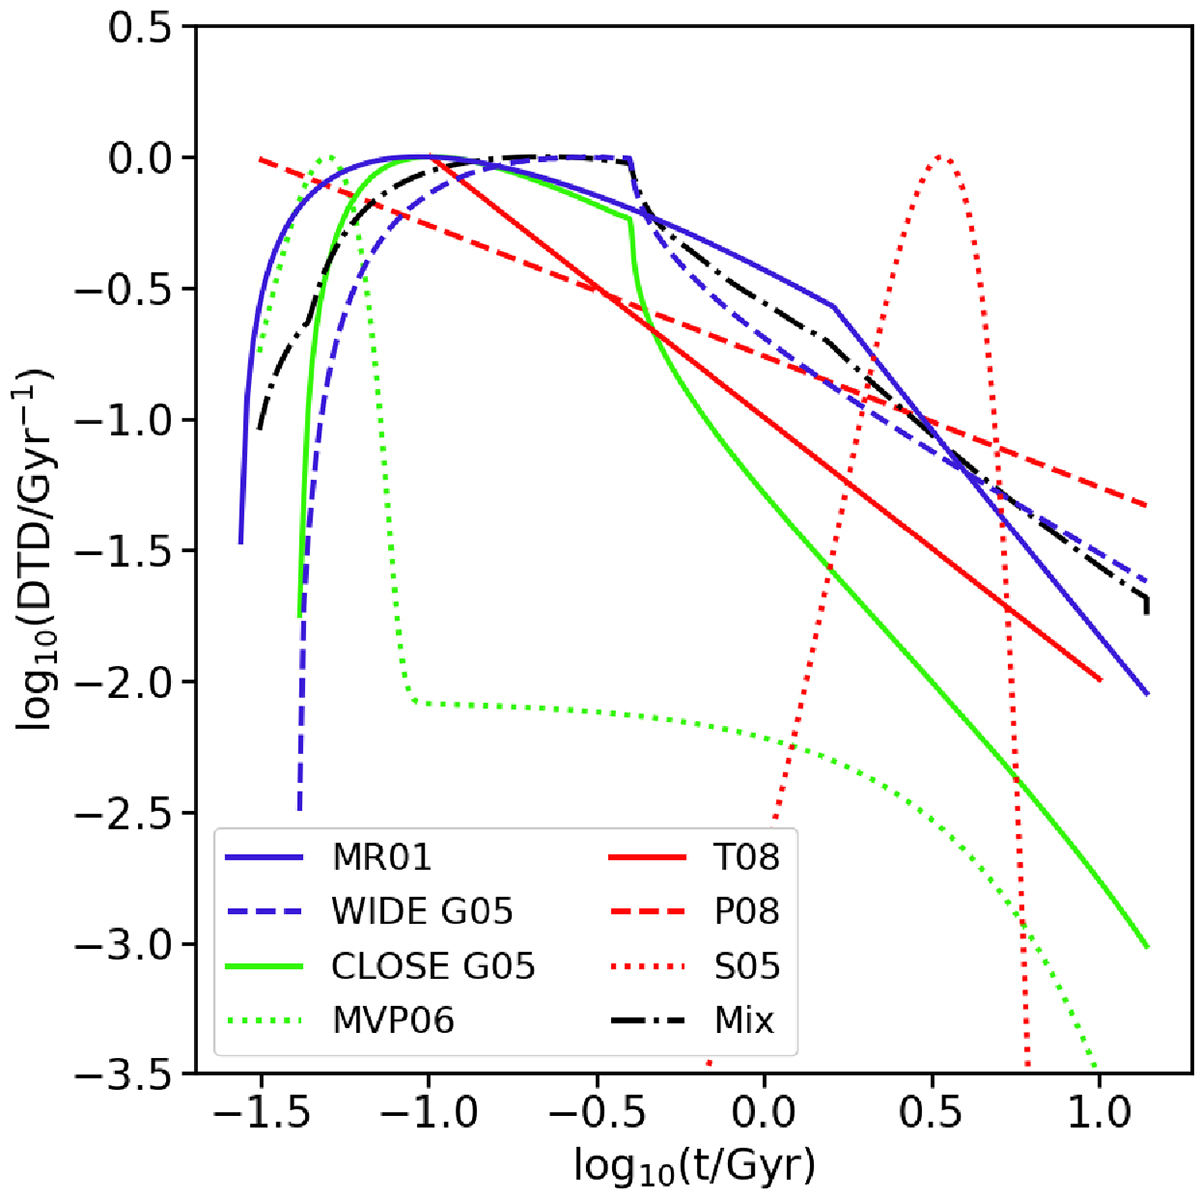
Fig. 1.
Download original image
Different DTD functions assumed in this work: Matteucci & Recchi (2001, solid blue curve); Mannucci et al. (2006, dotted green curve); wide and close from Greggio (2005, dashed blue and solid green curves, respectively); Totani et al. (2008, solid red curve); Pritchet et al. (2008, dashed red curve); and Strolger et al. (2005, dotted red curve). The optimal combination of DTDs detailed in Sect. 5.2 is denoted by the dotted-dashed black line. All the distributions are normalized by their maximum.
Current usage metrics show cumulative count of Article Views (full-text article views including HTML views, PDF and ePub downloads, according to the available data) and Abstracts Views on Vision4Press platform.
Data correspond to usage on the plateform after 2015. The current usage metrics is available 48-96 hours after online publication and is updated daily on week days.
Initial download of the metrics may take a while.