Fig. 9
Download original image
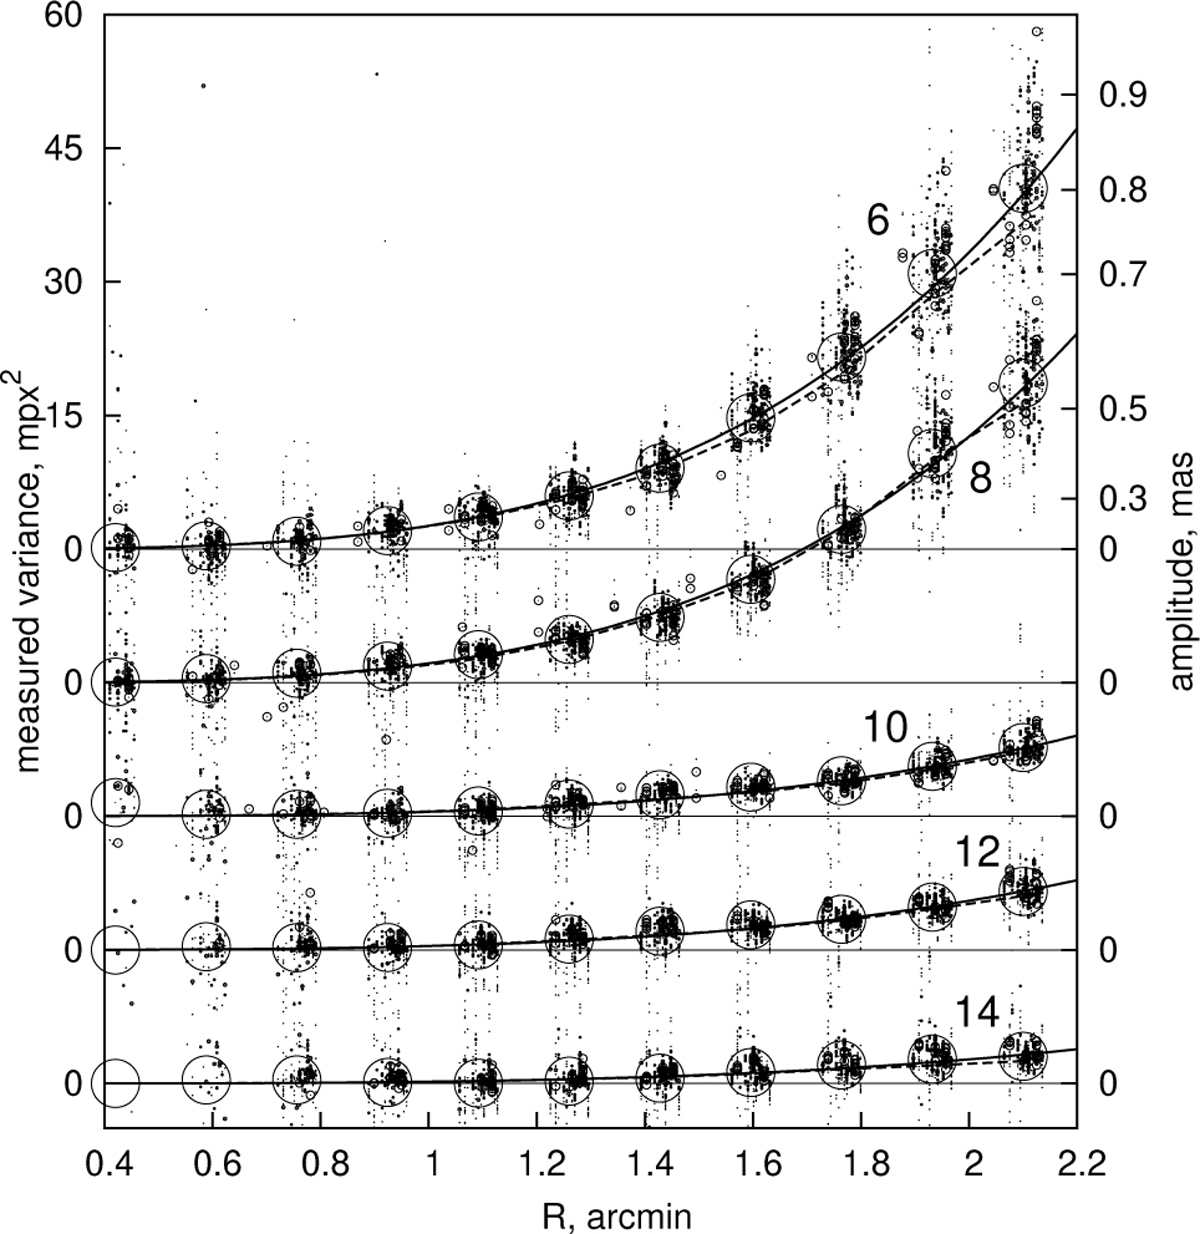
Each star variance ![]() as a function of field size R (dots; sizes are proportional to star brightness) for each reduction mode, their average
as a function of field size R (dots; sizes are proportional to star brightness) for each reduction mode, their average ![]() for each R (large circles), fit functions Eq. (36) (solid), and the DIM variance
for each R (large circles), fit functions Eq. (36) (solid), and the DIM variance ![]() (Eq. (26)) based on the atmospheric model (dashed lines). For better visualization, the plots for each k > 6 are shown with a negative offset. The dots are dispersed horizontally for different star fields.
(Eq. (26)) based on the atmospheric model (dashed lines). For better visualization, the plots for each k > 6 are shown with a negative offset. The dots are dispersed horizontally for different star fields.
Current usage metrics show cumulative count of Article Views (full-text article views including HTML views, PDF and ePub downloads, according to the available data) and Abstracts Views on Vision4Press platform.
Data correspond to usage on the plateform after 2015. The current usage metrics is available 48-96 hours after online publication and is updated daily on week days.
Initial download of the metrics may take a while.